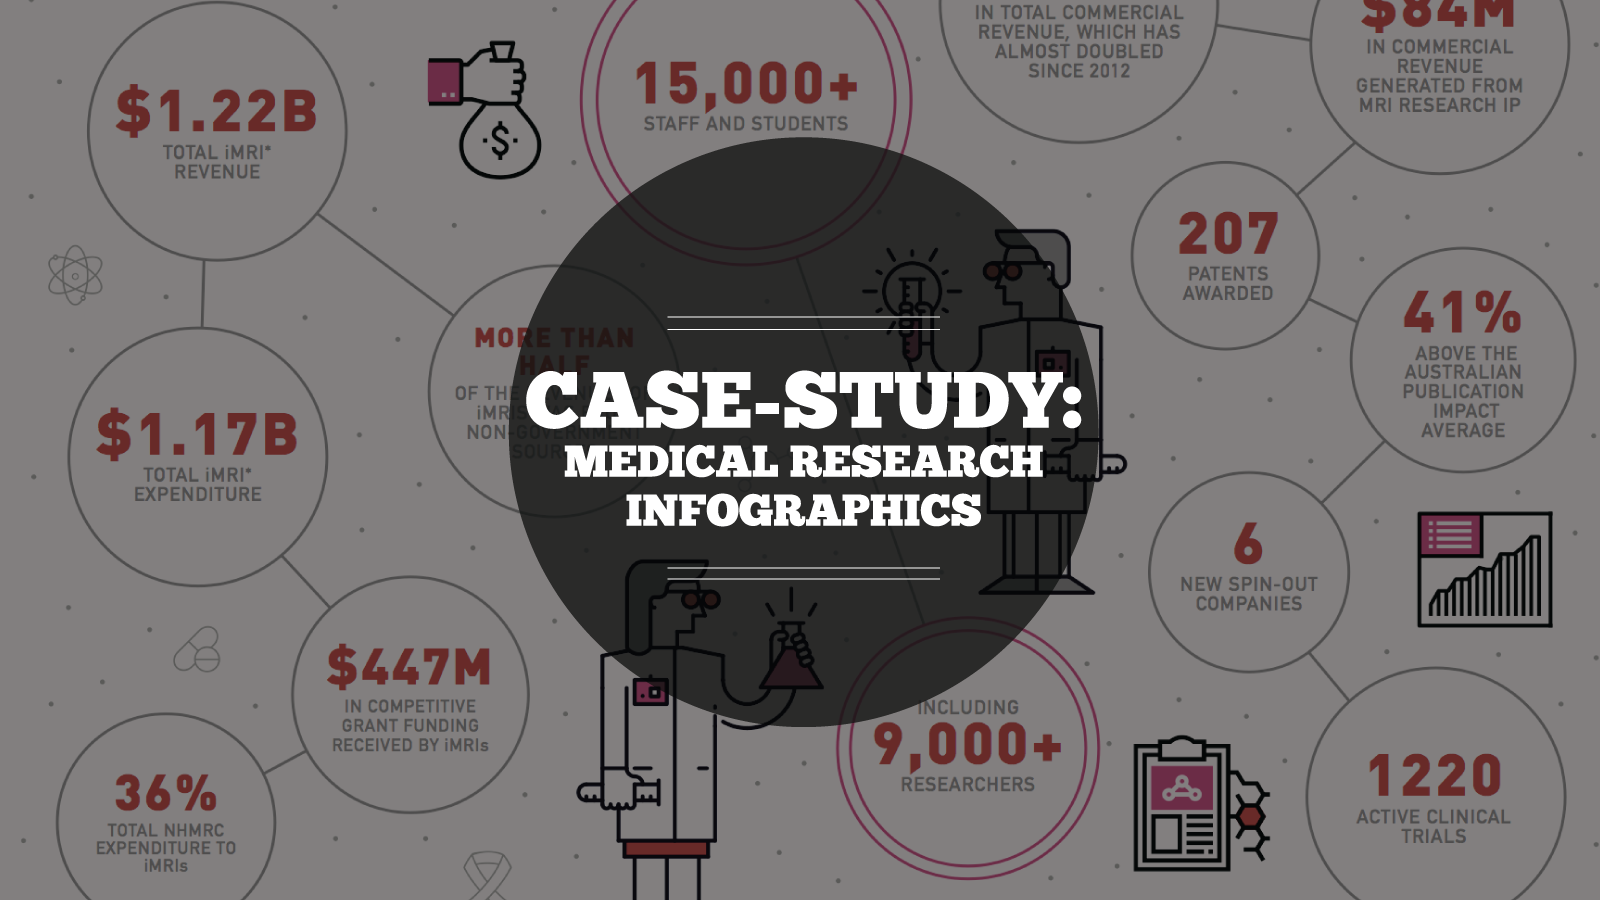
Case-study: Medical Research Infographic Who: Association of Australian Medical Research Institutes What: Summary Report Infographic When: August 2016 Why: The team at Association of Australian Medical Research Institutes (AAMRI) is
Datalabs is looking for a Full Time Data Visualizer with experience in designing in Adobe Illustrator, as well as coding in JavaScript, CSS, and HTML. Presentation, public speaking skills also

Datalabs’ Junior Tableau Developer is responsible for the end-to-end creation of solutions using the advanced data visualisation tool Tableau. We provide our clients with business intelligence dashboards that utilise best
We’re looking to add an infographic designer to our team here at Datalabs. About the Infographic Designer role: Our Infographic Designers are the agency’s creative visualisers and graphic designers, working
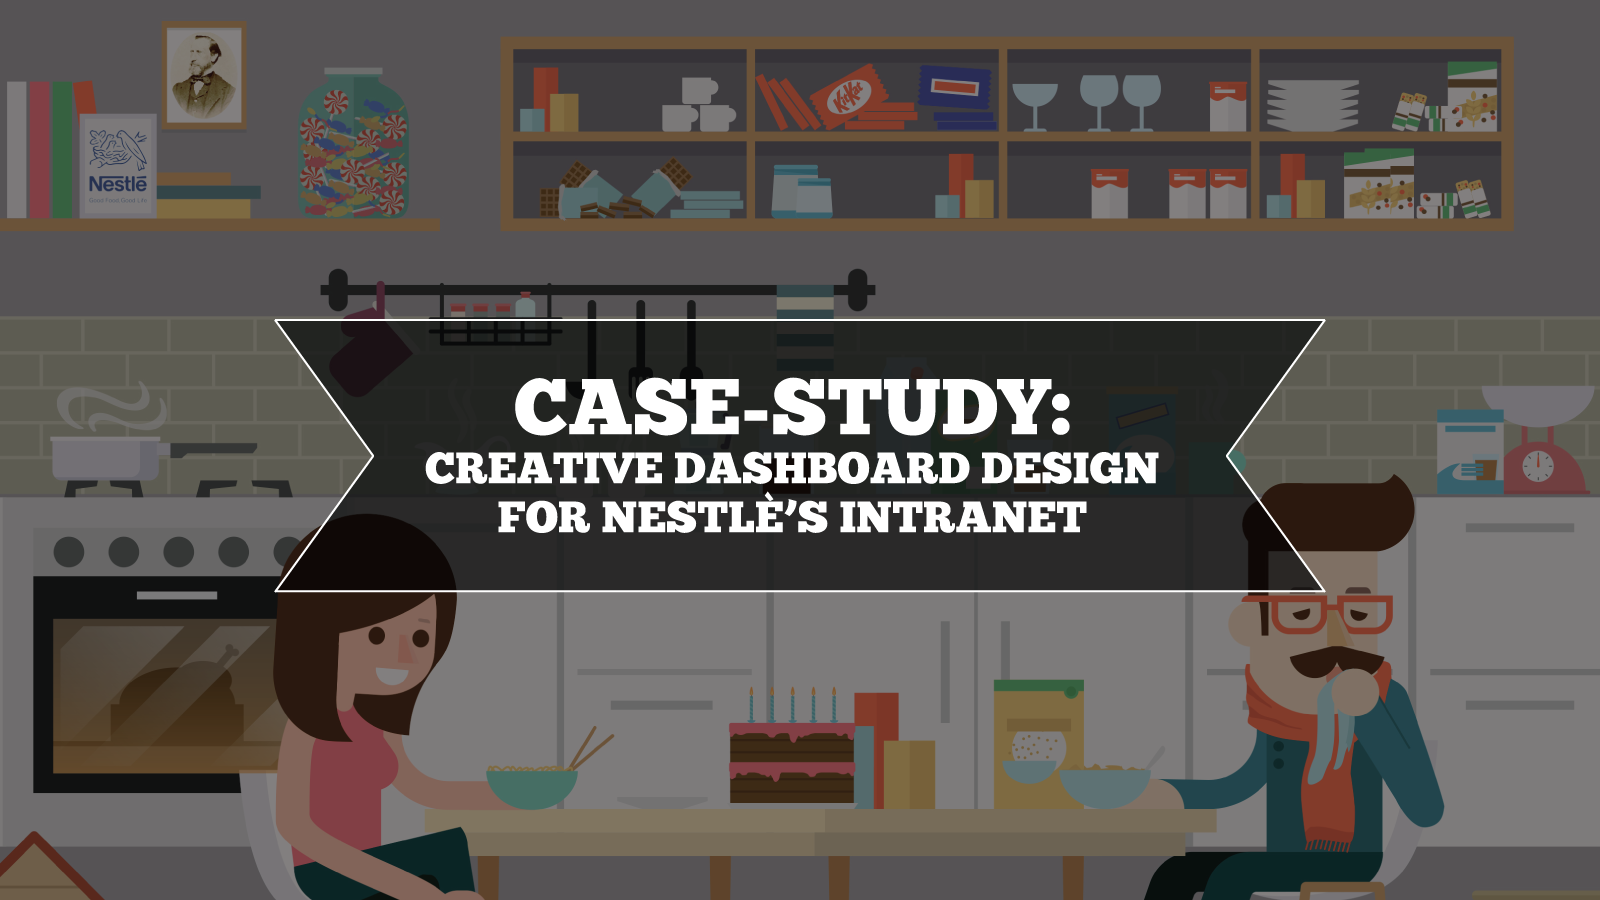
Case-study: Intranet Dashboard Design for Nestlé Who: Nestlé What: Intranet dashboard landing page design When: May 2016 Why: When you are constantly focused on the needs of your customers and
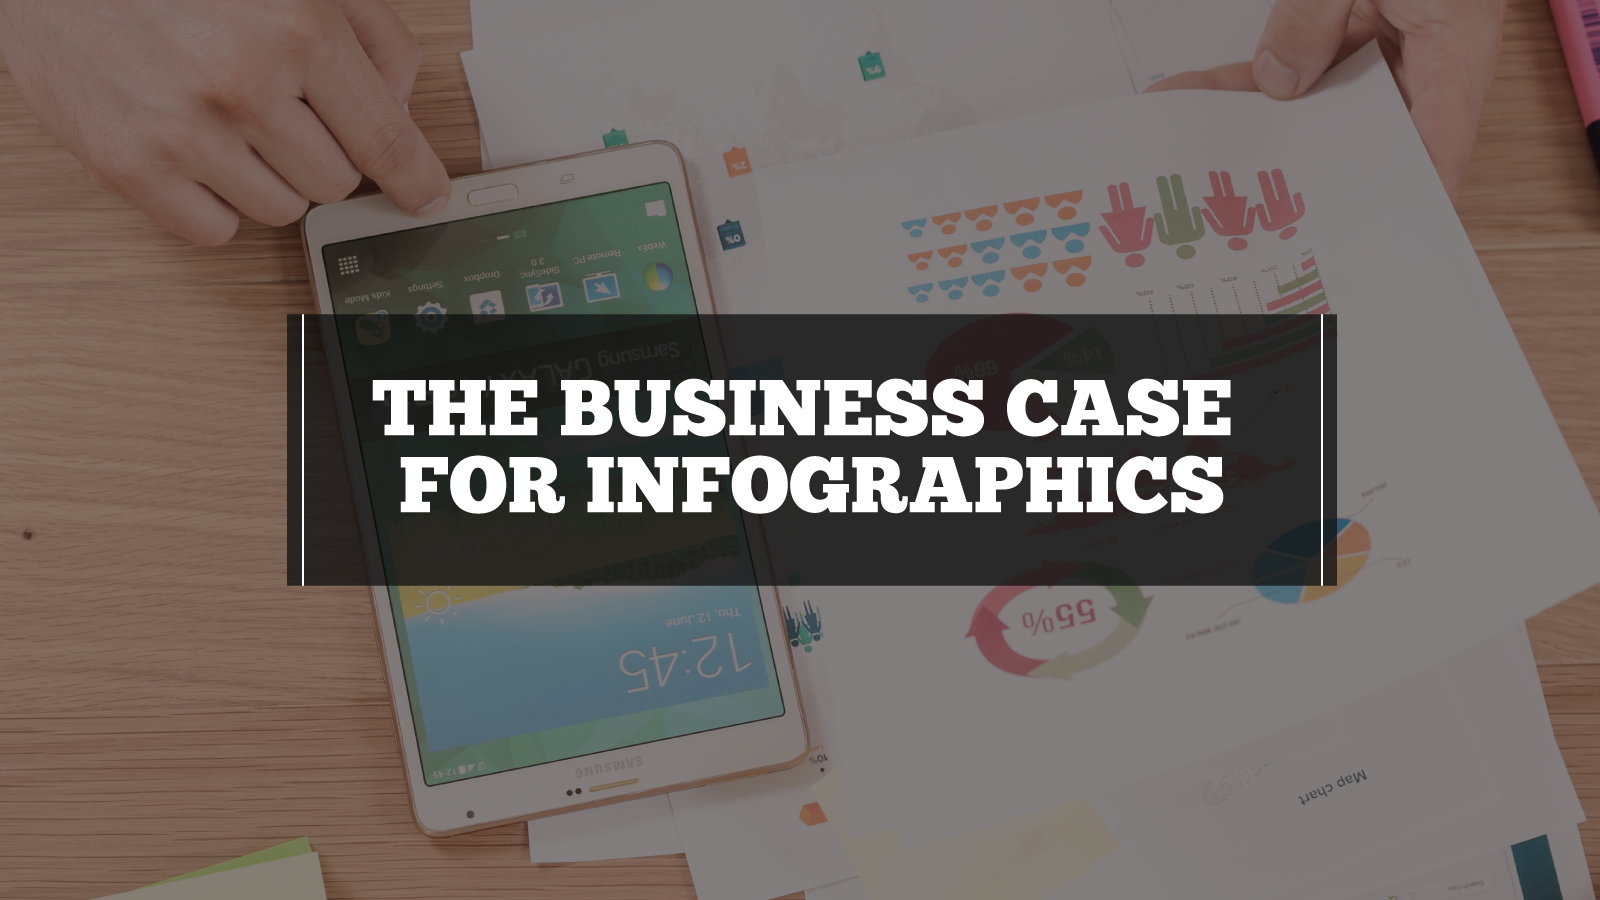
What Is The Business Case for Infographics? How You Prove The Value In Better Communication, Information Design & Reporting Your business has data and information. And your business needs to
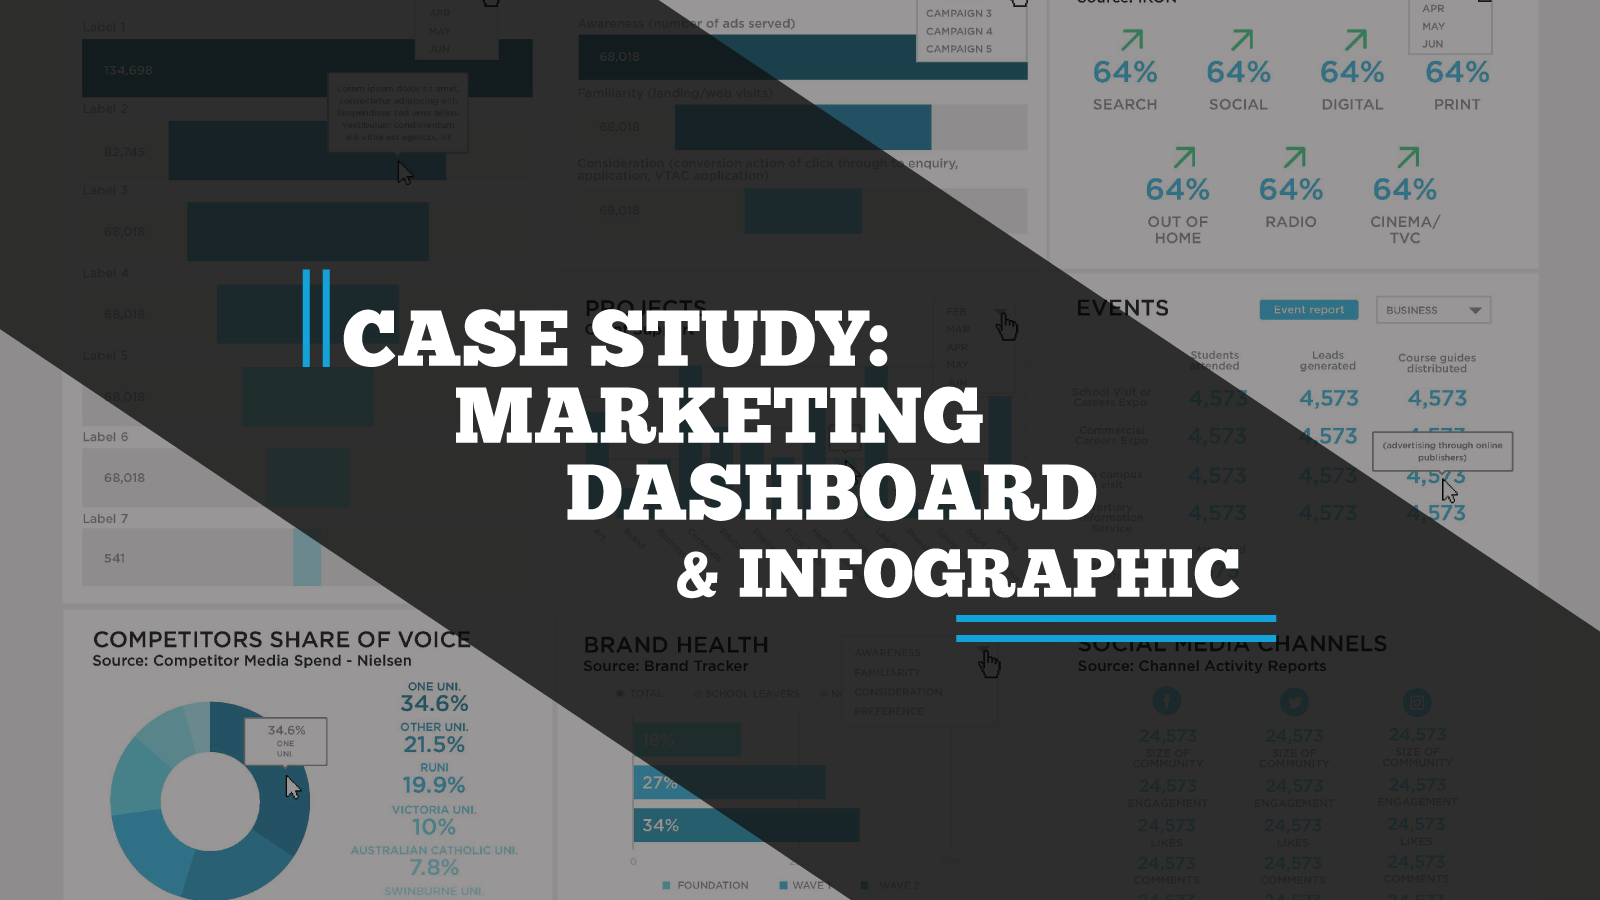
Case-study: Victoria University Dashboards & Infographic Reports Who: Victoria University What: Tableau Business Dashboards & Infographic Reports When: October 2016 Why: In the world of Universities, much data develops and
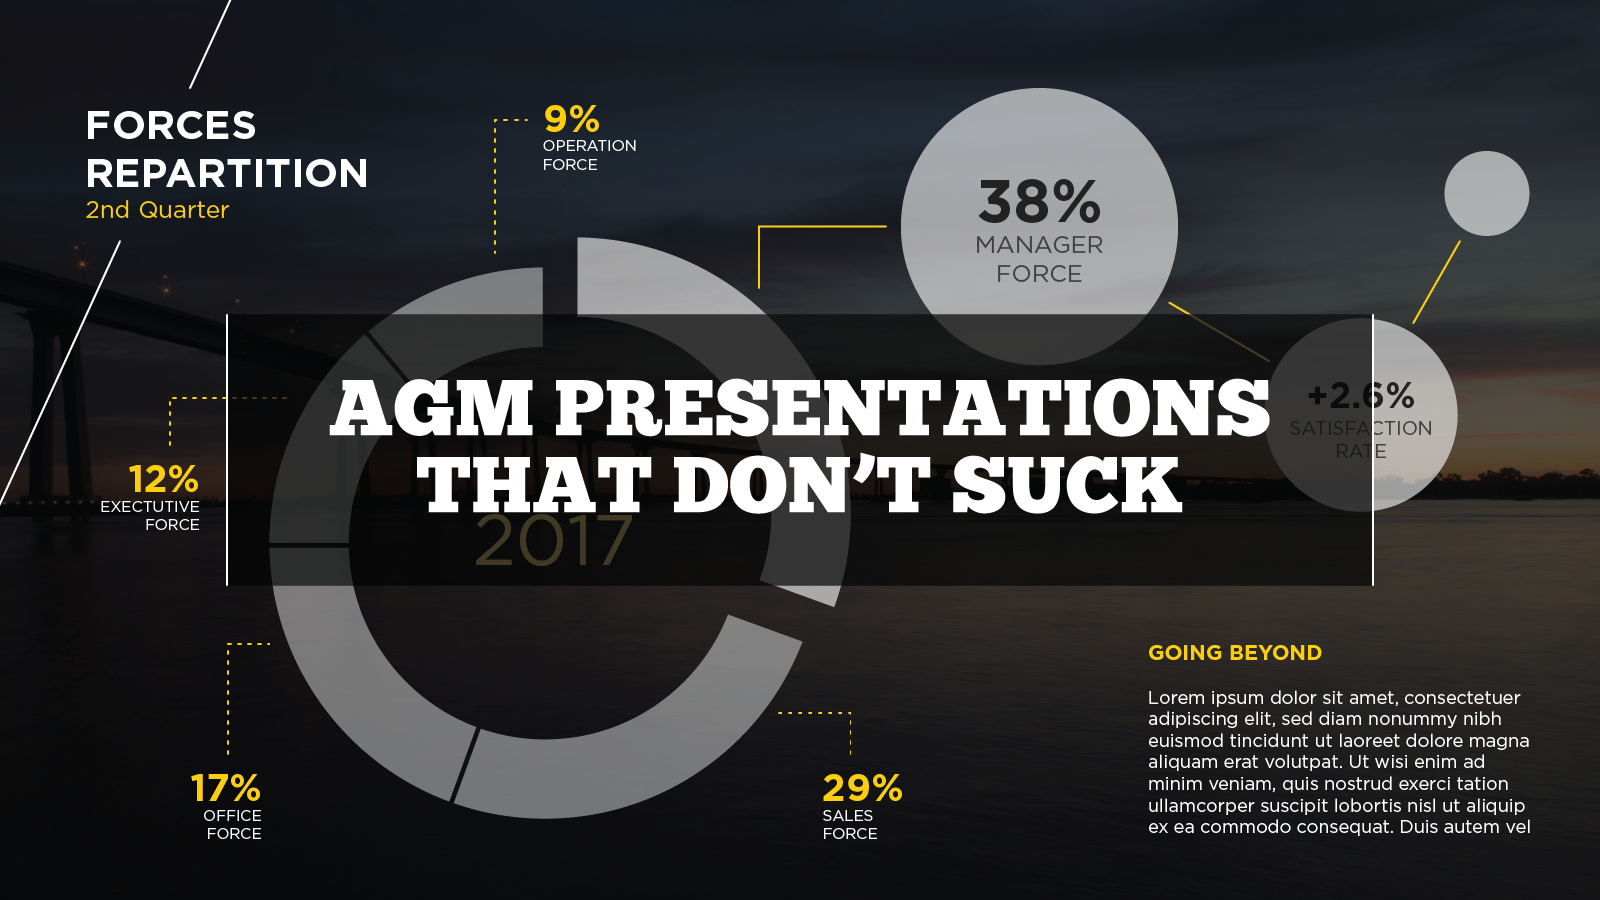
AGM Presentations That Don’t Suck The Best AGM Presentations Whether it be for shareholder relations, membership associations, chairpersons or a mix of everyone – Annual General Meetings exist to flaunt
The 2016 Data Visualization Format of the Year (Third Place): Style guides Formatting all data visualization with best practice principles You may have seen our first and second place winners

Six Reasons to Gift Skills Training to Your Employees The benefits to both individuals and businesses as a whole At the Datalabs Agency, we’re firm believers in hiring great people