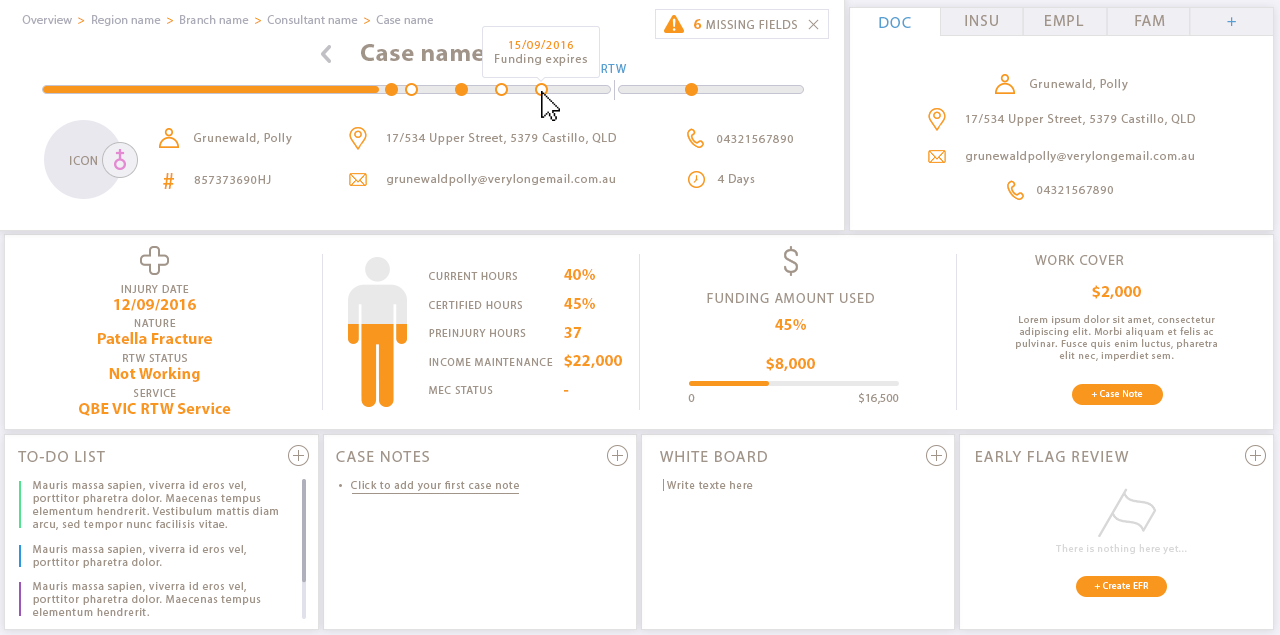
CRM Dashboard & User Interface Design Case Study

Al Jazeera Infographic Workshop Case Study 2 days with Al Jazeera Journalists, Producers & Designers talking about infographics, data and process. Where: Onsite at Al Jazeera HQ in Qatar
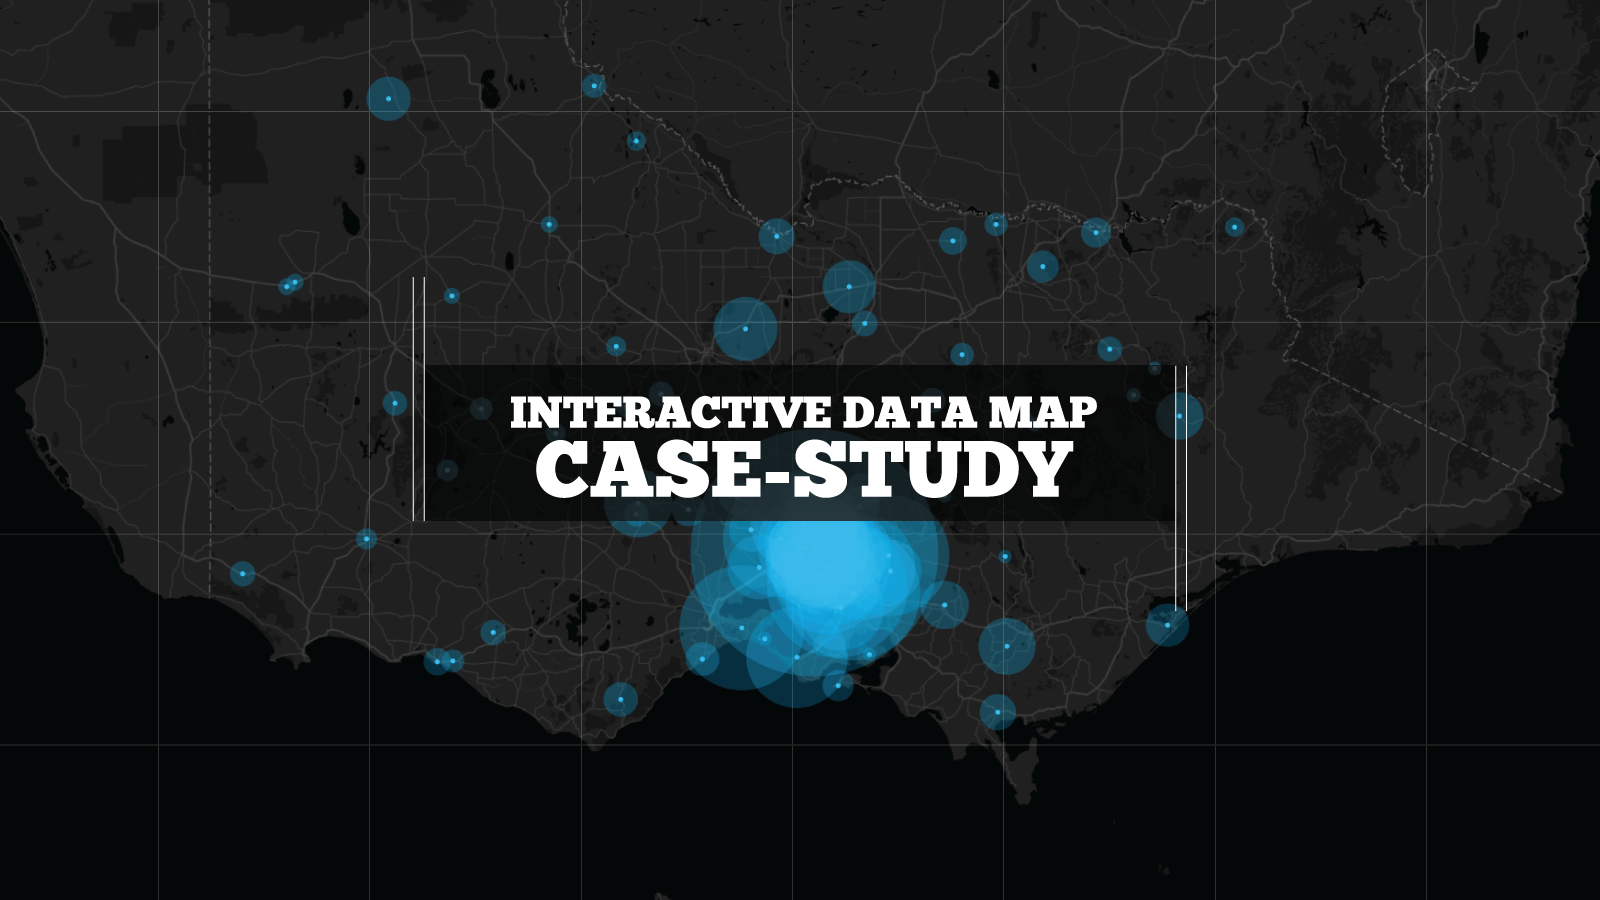
Interactive Data Mapping Case Study The interactive map is designed with d3 and Google Maps API Pulls data from ABS traffic accident data Interactive map combined with data visualisation Who:
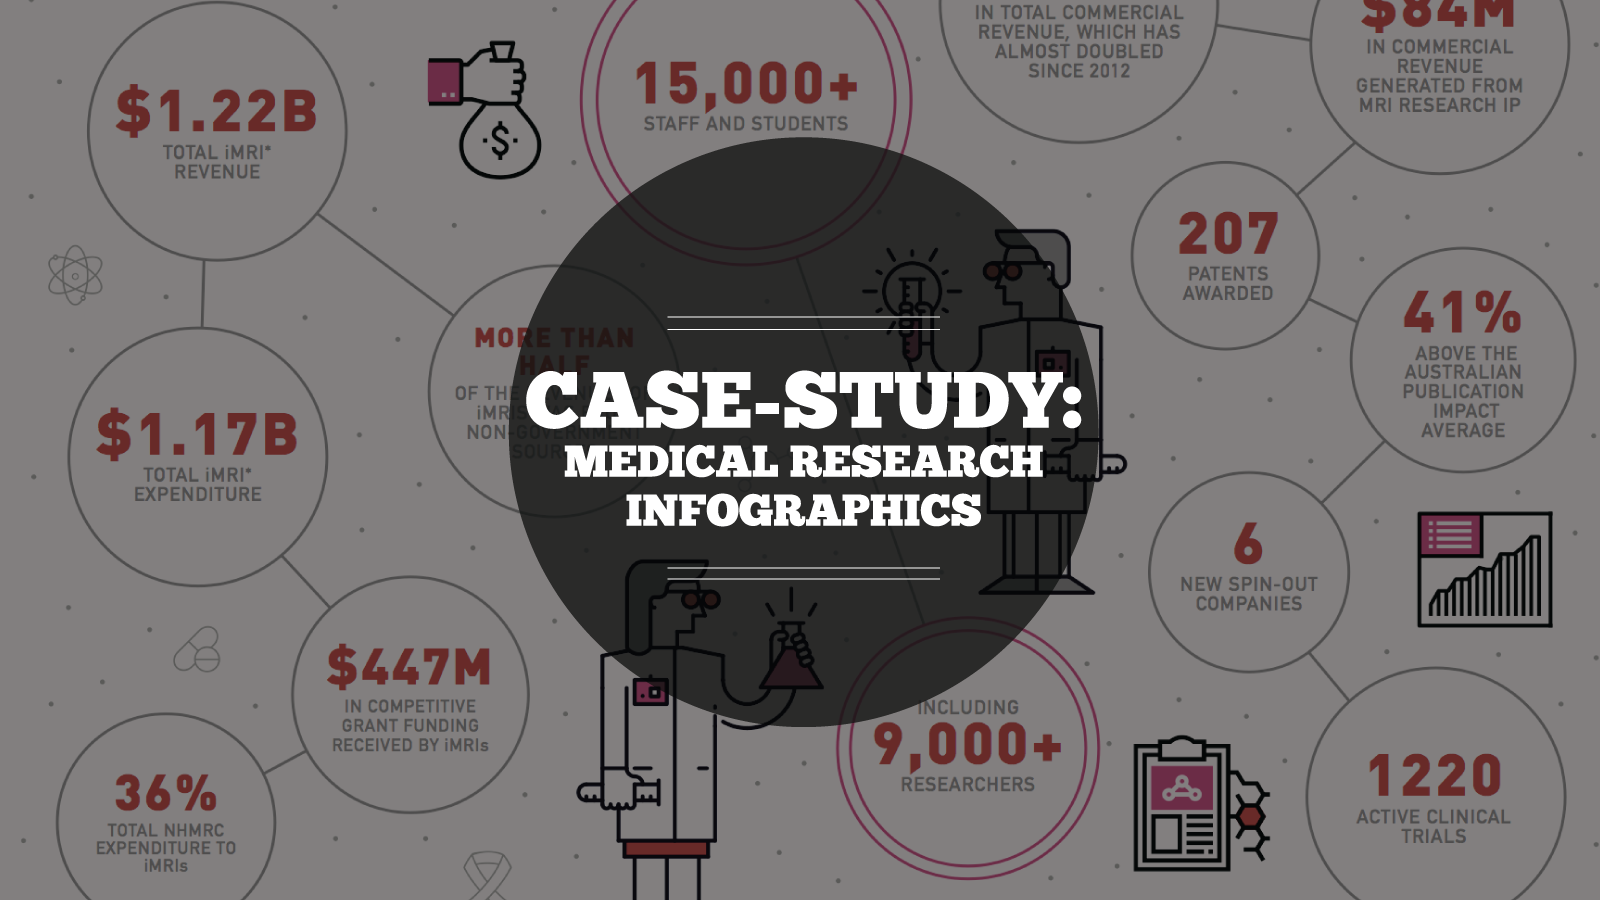
Case-study: Medical Research Infographic Who: Association of Australian Medical Research Institutes What: Summary Report Infographic When: August 2016 Why: The team at Association of Australian Medical Research Institutes (AAMRI) is
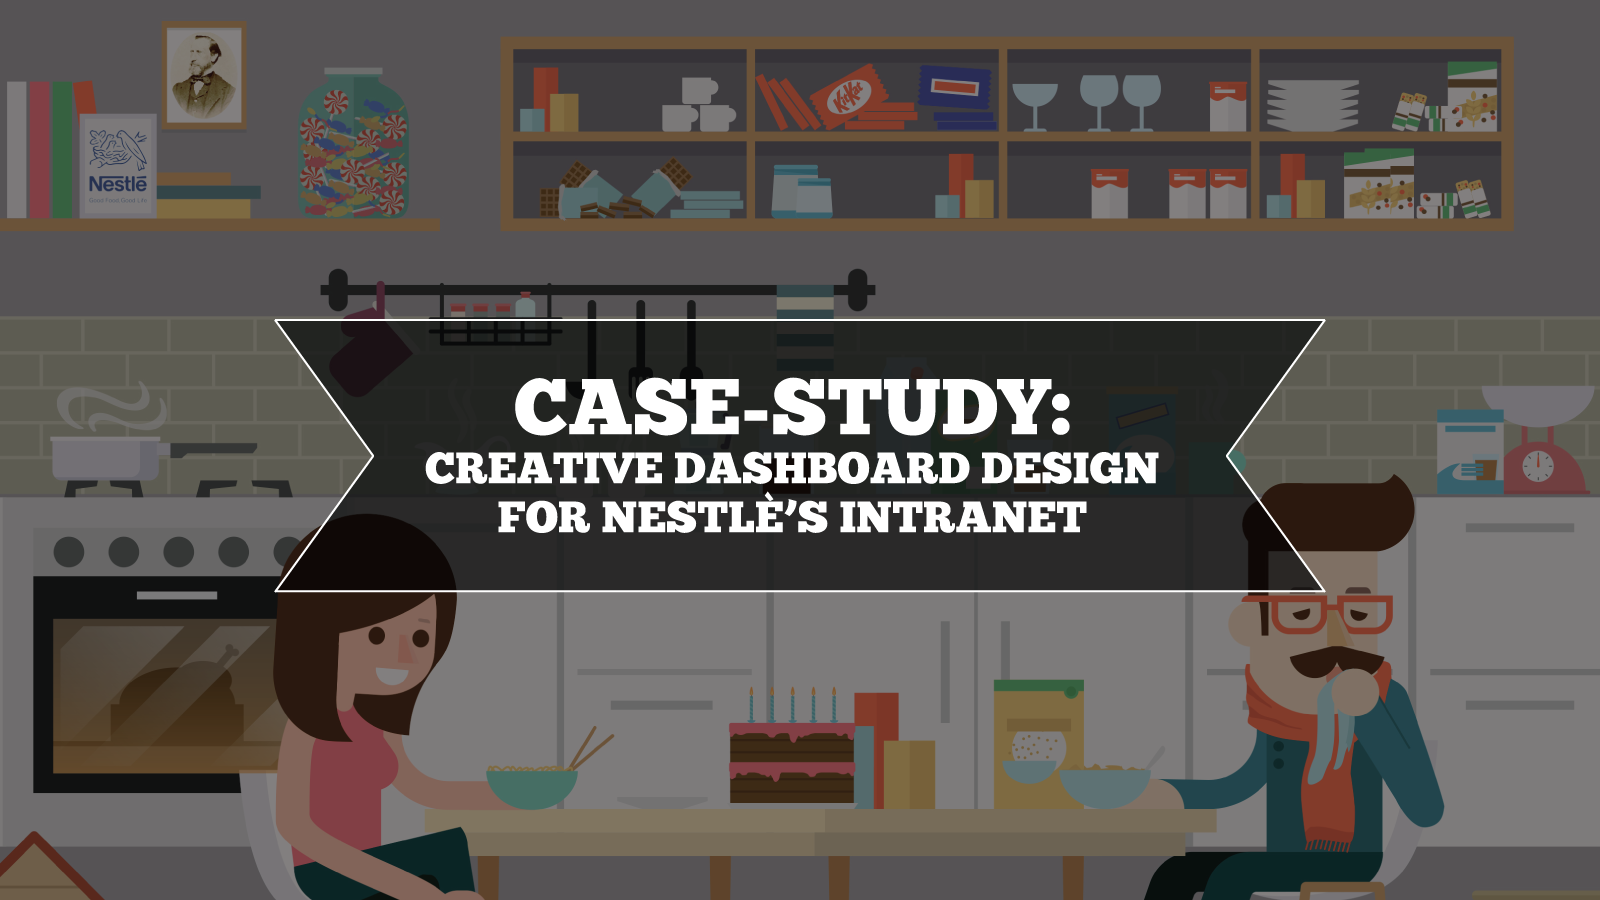
Case-study: Intranet Dashboard Design for Nestlé Who: Nestlé What: Intranet dashboard landing page design When: May 2016 Why: When you are constantly focused on the needs of your customers and
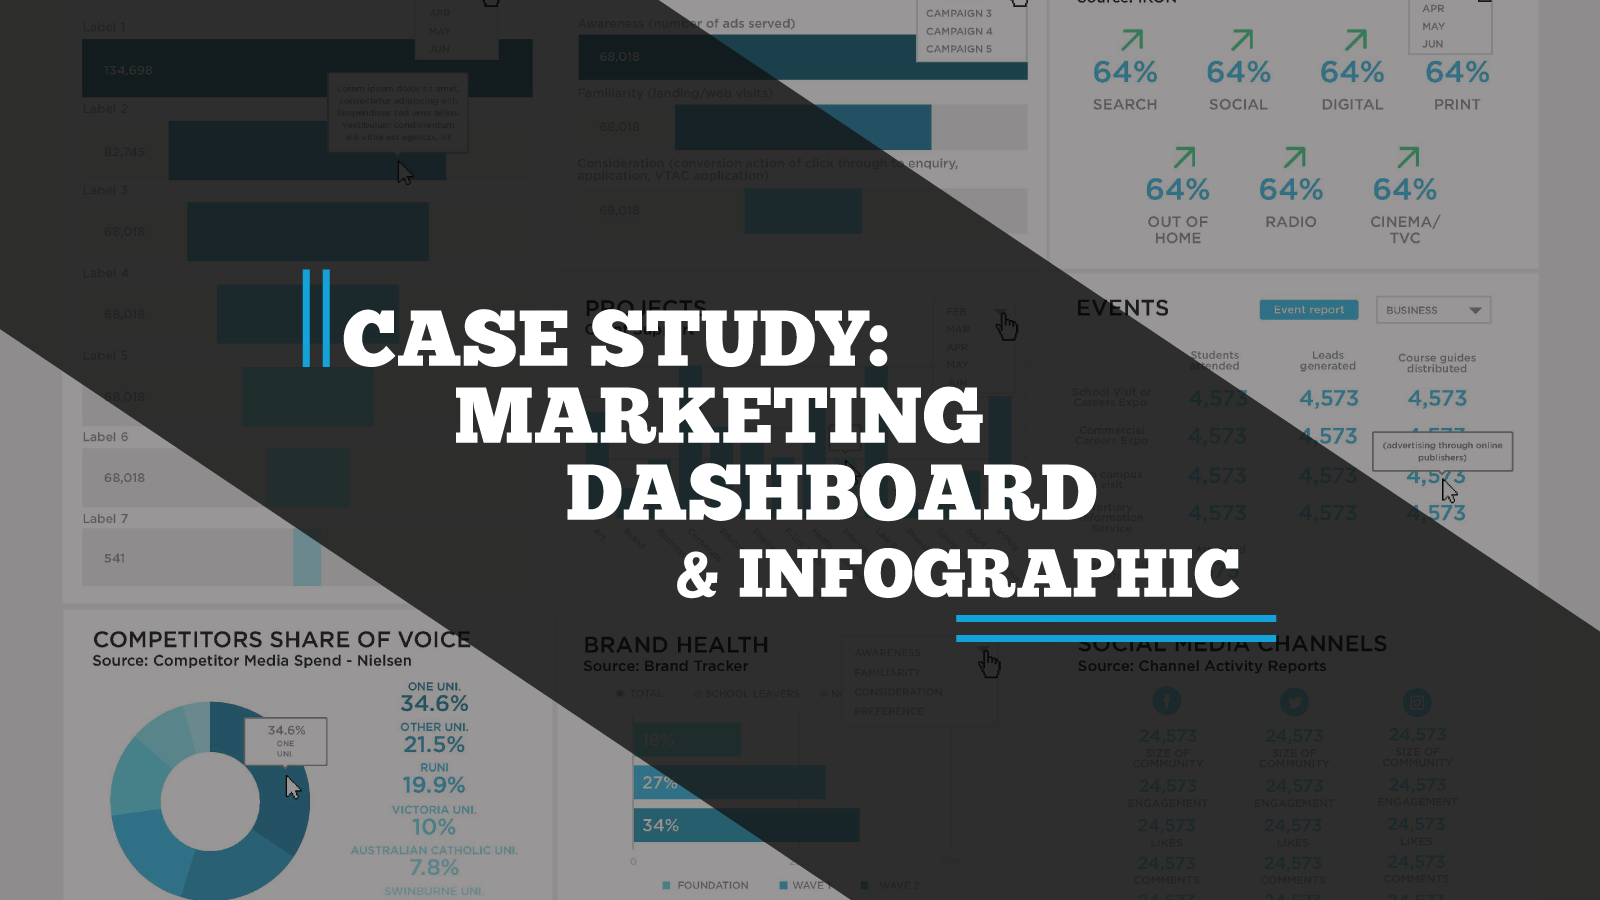
Case-study: Victoria University Dashboards & Infographic Reports Who: Victoria University What: Tableau Business Dashboards & Infographic Reports When: October 2016 Why: In the world of Universities, much data develops and
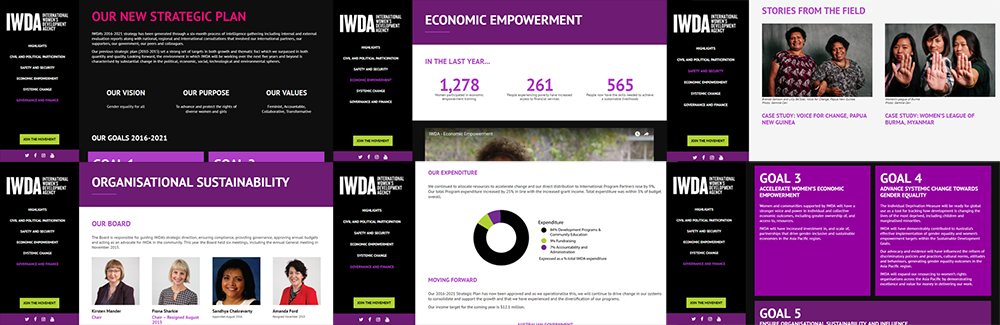
IWDA 2016 Annual Report Microsite case study A real, live example of Datalabs’ digital annual report. Who: International Women’s Development Agency (IWDA) What: 2016 Digital Annual Report When: October 2016
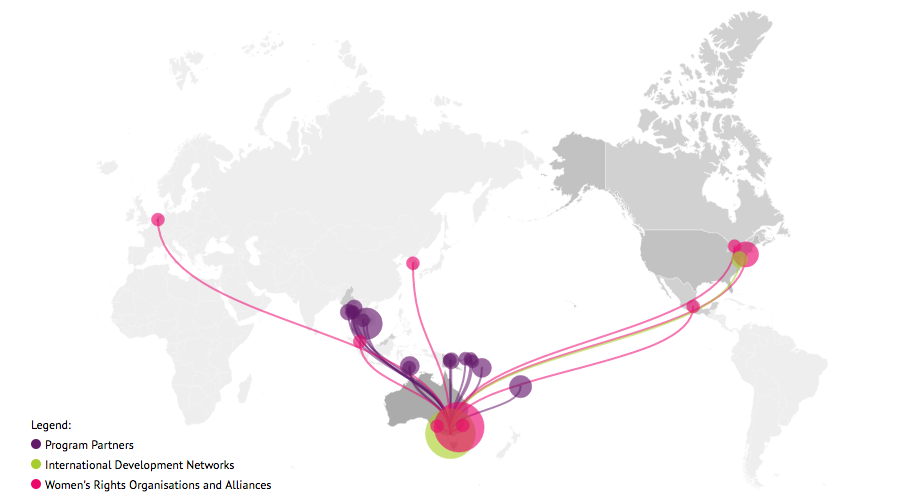
Digital Animated Map Case Study A real, live example of an interactive map developed for International Women’s Development Agency. Click on the nodes to interact Who: International Women’s Development Agency

Interactive Timeline User Journey – Click The Infographic A project for Monash Health showing customers journey through the healthcare system over 9 years Timeframe: 8 weeks Tools: Adobe Illustrator, Excel, HTML/JS/CSS
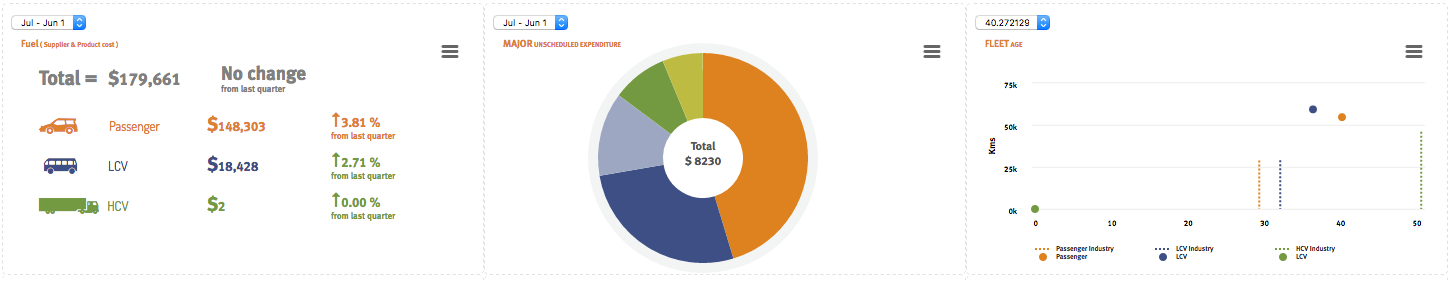
Financial Operations & Reporting BI Dashboards A business dashboard for reviewing risk Our client offers vehicle fleet leasing and management, Australia-wide and internationally. Their solutions are time saving and cost effective, as well