Big Data Infographic Report A recent report by SAP finds that the so-called power of Big Data has yet to be unlocked by decision makers. Datalabs has designed an infographic
Programmatic advertising budgets are growing. The need for automation and the control of the buying process and marketing data is opening up new ways of purchasing digital advertising inventory. Real-time
CPA Australia Infographic Reports From data discovery to design Datalabs worked with CPA Australia to distill the insights from their Corporate Governance report on the Asian Pacific Region. The infographic
Xero Infographic Report Designed by Datalabs At Datalabs, we create data visualisations for a range of clients and business types. We love what we do, but we can’t help but
We’ve compiled a small list of conferences definitely worth visiting in 2013. Events like this are a great way to see, learn, connect and be inspired. If you’re lucky enough to get a ticket, be sure to let us know so we could meet up and have a chat.
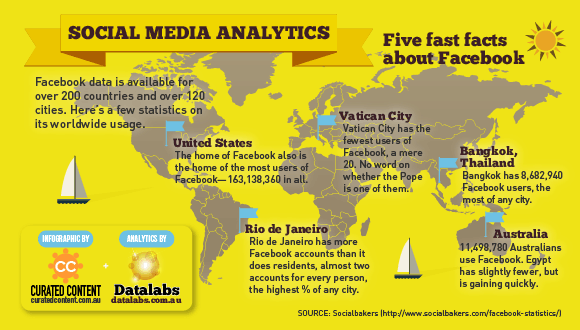
Facebook data is available for over 200 countries and over 120 cities. This infographic shows a few statistics on its worldwide usage. [alert_box type=”note”]Click the image above to see a PDF