
Do you know what your digital marketing system looks like? Like, physically, looks like? Imagine a network of veins, valves, and organs — all labelled for clarity, informing everyone who

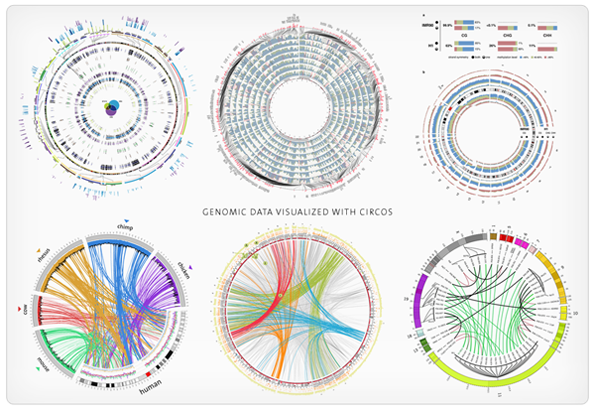
5 Captivating Information Visualization Examples Beyond Infographics, Charts & Graphs Thanks to the ubiquitous infographic, most people are well-acquainted with information visualization. But infographics aside, we believe the field of

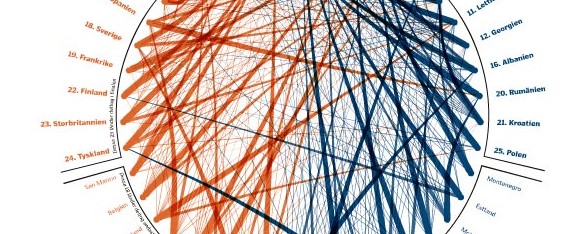
Data visualisation is a powerful way to communicate new and complex information – When done right, it can deliver your message with both the weight of respected research, and the

The Need For Data Visualisation Skills In Business A guide to skilling-up your employees An SAP-sponsored survey recently questioned business leaders about their opinions regarding the uptake and effectiveness

There's plenty of software to muck around with data, but to gain the skills to really get something out of it, that takes time and experience. Mikio Braun, a post doc in machine learning, explains . For a number of reasons, I don’t think that you cannot "toolify" data analysis that easily
When I meet with people and talk about our work, I get asked a lot what technology we use to create interactive and dynamic data visualizations. At Interactive Things, we have a set of preferred libraries, applications and services that we use regularly in our work. We will select the most fitting tool for the job depending on the requirements of the project

All industries have a critical need for visual analytics. The insights that can come immediately from a well-designed business dashboard or data visualization in the finance industry could provide the
We’ve compiled a small list of conferences definitely worth visiting in 2013. Events like this are a great way to see, learn, connect and be inspired. If you’re lucky enough to get a ticket, be sure to let us know so we could meet up and have a chat.
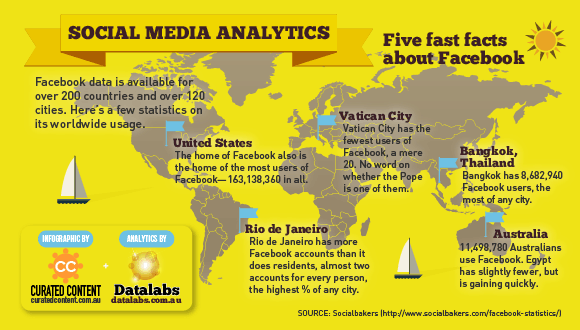
Facebook data is available for over 200 countries and over 120 cities. This infographic shows a few statistics on its worldwide usage. [alert_box type=”note”]Click the image above to see a PDF