Copywriter & Data Journalist – Melbourne Datalabs is looking for a Data Journalist with experience in interpreting content and data into simple stories for use in our agency’s infographic reports, animated
Datalabs is looking for a Full Time Data Visualizer with experience in designing in Adobe Illustrator, as well as coding in JavaScript, CSS, and HTML. Presentation, public speaking skills also
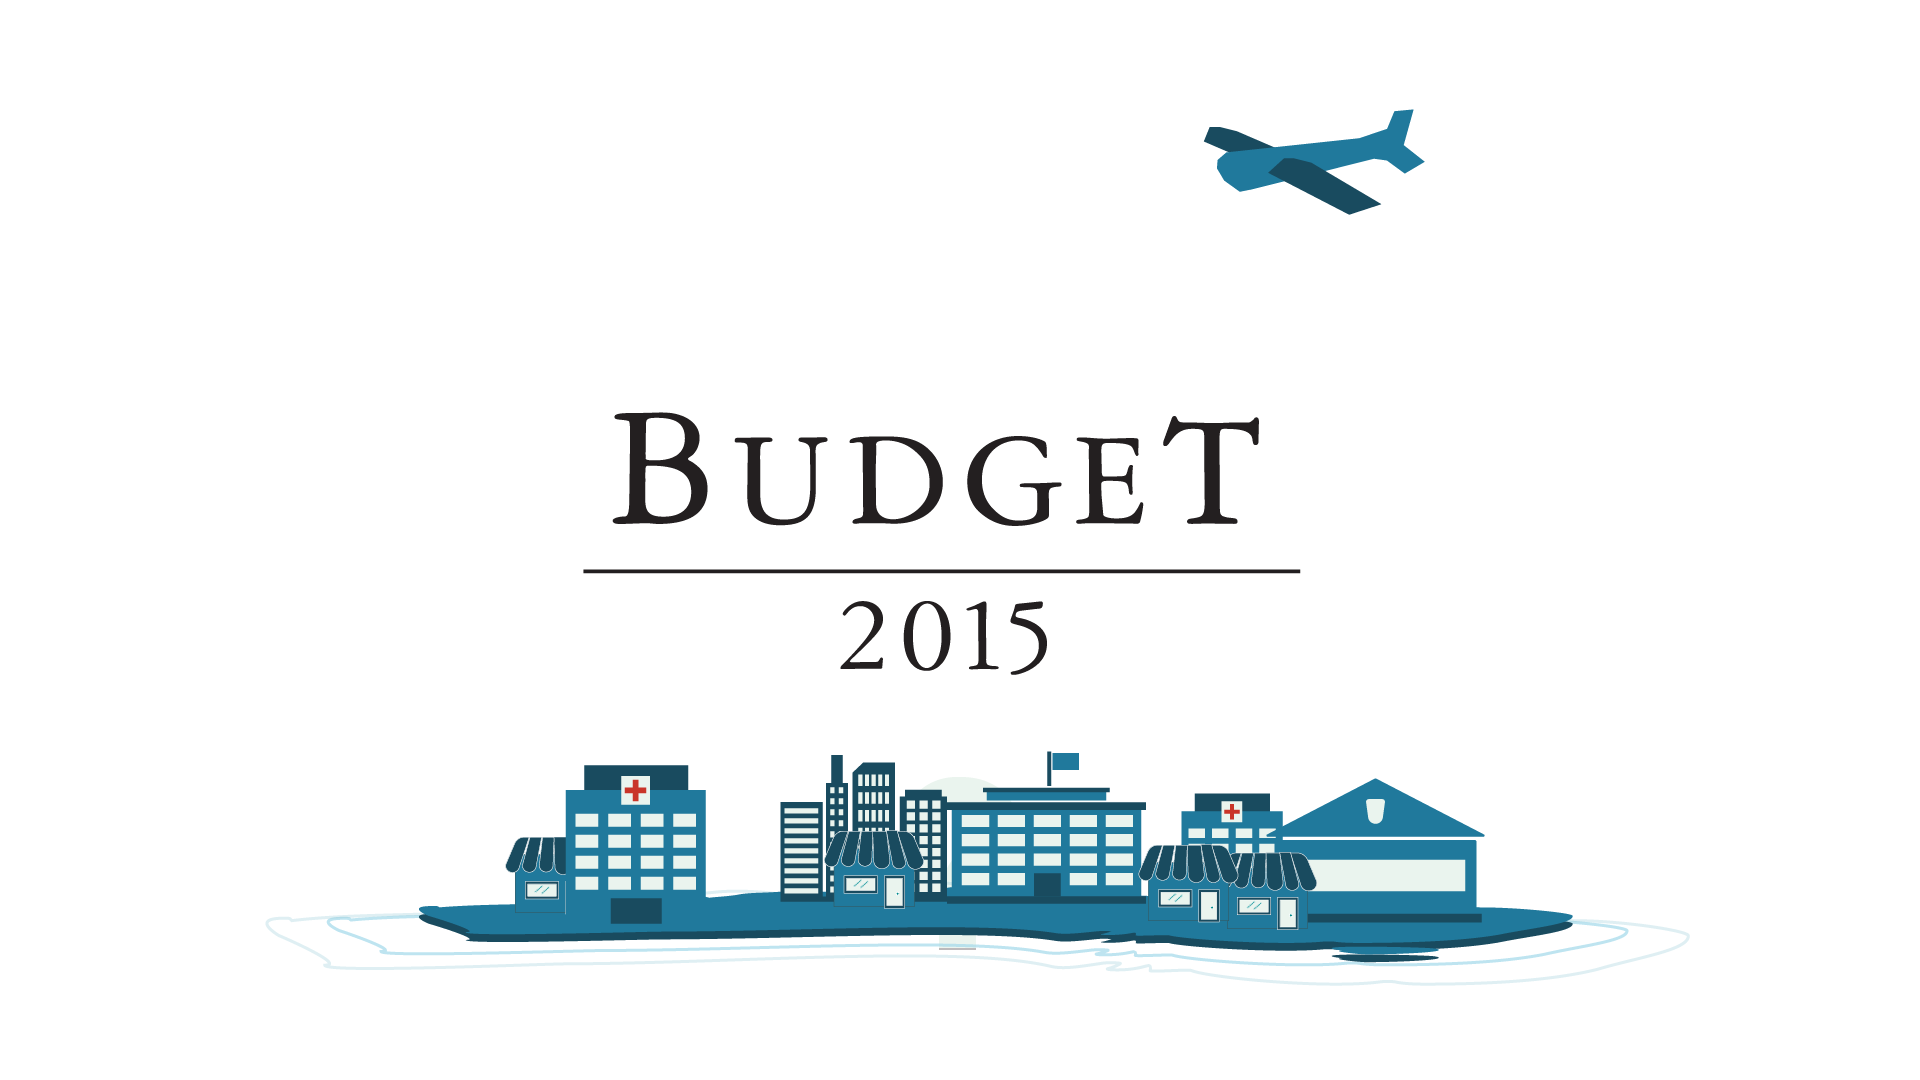
Datalabs is proud to show our work with the Federal Department of the Treasury for the 2015 Budget. Datalabs was hired in April to animate three videos, visualising the overview
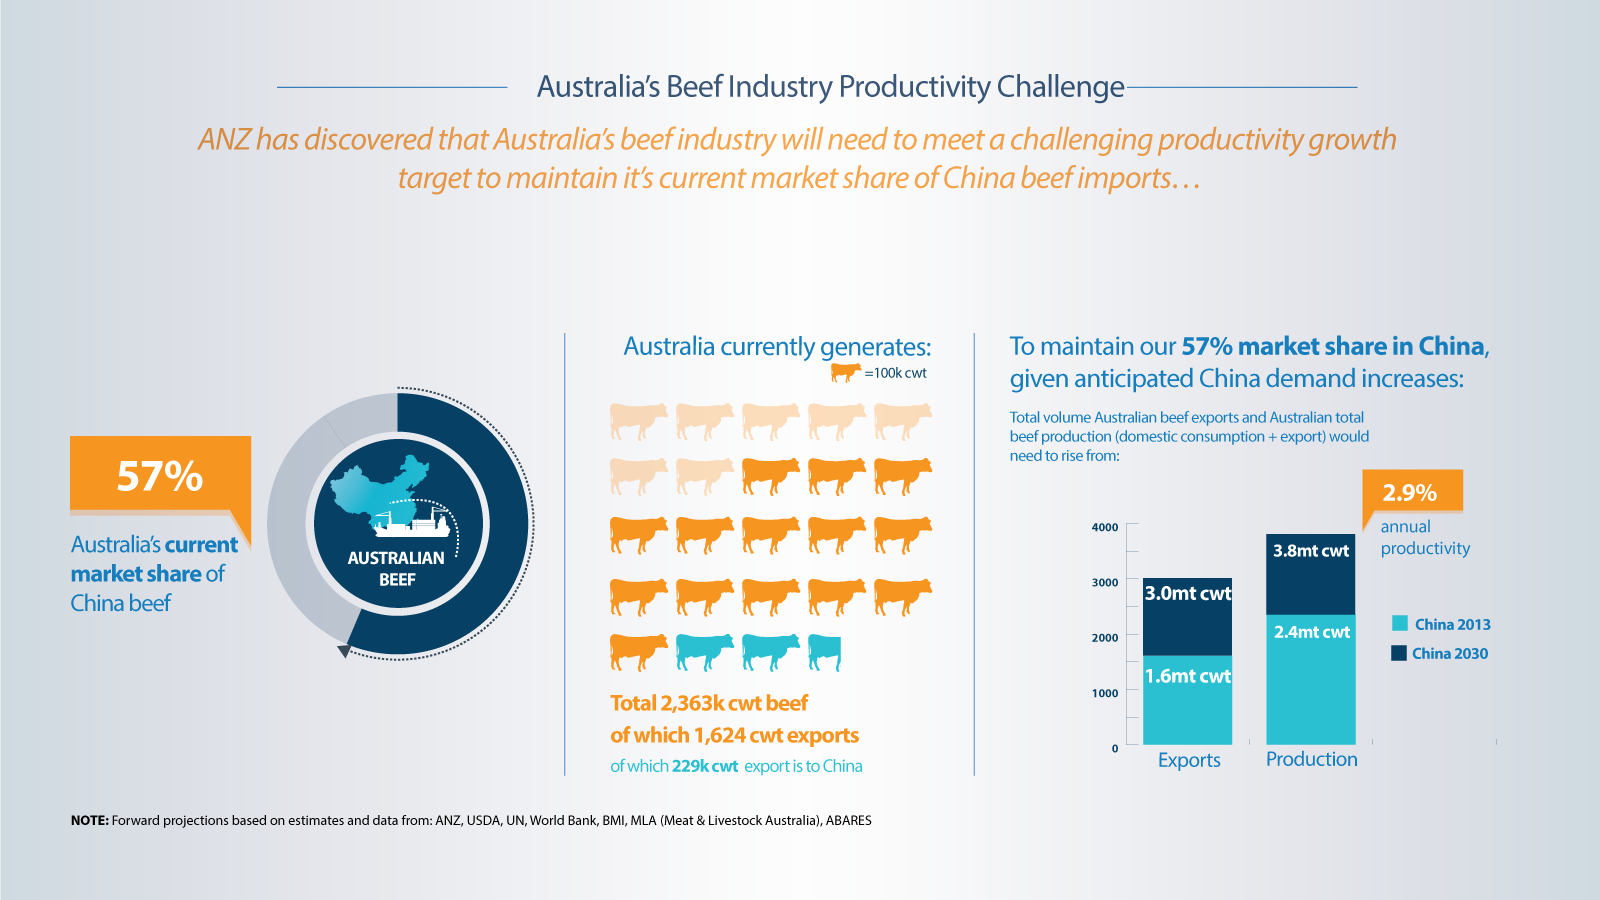
Recent work we completed for ANZ’s International & Institutional Banking division on China Beef. This animated data video leverages the data visualisation and infographic design work Datalabs’ team created and
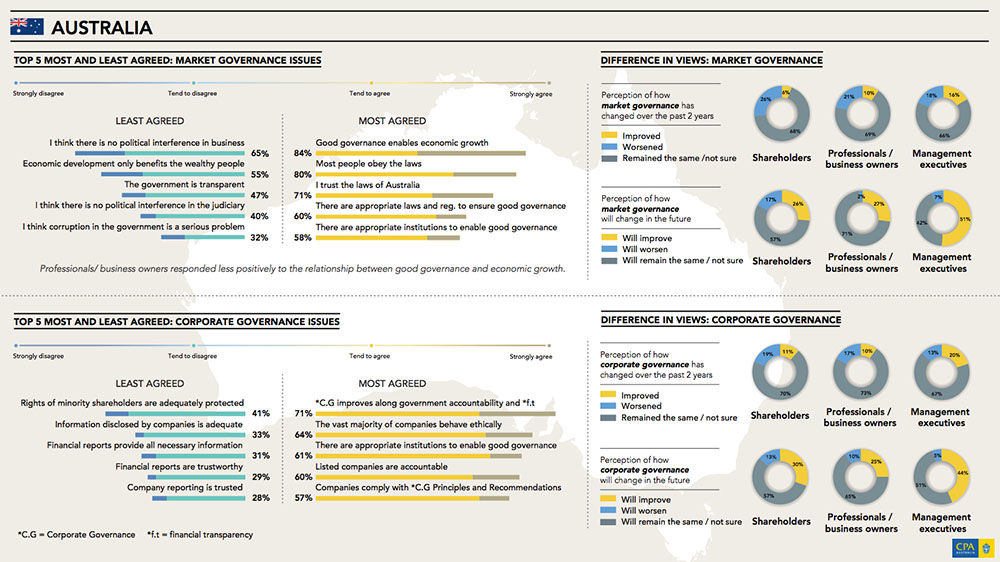
CPA Australia Infographic Reports From data discovery to design Datalabs worked with CPA Australia to distill the insights from their Corporate Governance report on the Asian Pacific Region. The infographic

All industries have a critical need for visual analytics. The insights that can come immediately from a well-designed business dashboard or data visualization in the finance industry could provide the
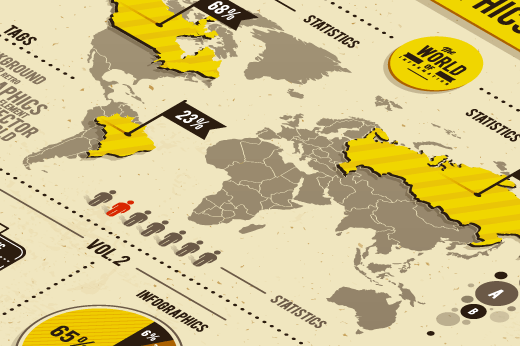
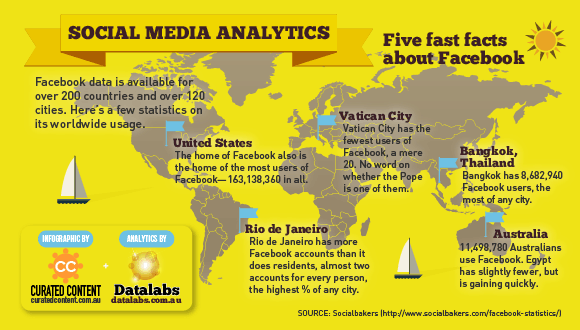
Facebook data is available for over 200 countries and over 120 cities. This infographic shows a few statistics on its worldwide usage. [alert_box type=”note”]Click the image above to see a PDF