Copywriter & Data Journalist – Melbourne Datalabs is looking for a Data Journalist with experience in interpreting content and data into simple stories for use in our agency’s infographic reports, animated
We’re looking to add an infographic designer to our team here at Datalabs. About the Infographic Designer role: Our Infographic Designers are the agency’s creative visualisers and graphic designers, working

Six Reasons to Gift Skills Training to Your Employees The benefits to both individuals and businesses as a whole At the Datalabs Agency, we’re firm believers in hiring great people
Six Questions Content Marketers Should Ask of Their Google Analytics Data Understanding the value and ROI of content is an imperative to modern marketing analytics. Here are some great ways

Datalabs is looking to add an Animator & Motion Graphic Designer to our team here at Datalabs. About the Animator & Motion Graphic Designer role: Our Animators & Motion Graphic
We’re looking to add an infographic design intern to our team here at Datalabs. About the Infographic Designer (Intern) role: Our Infographic Designers are the agency’s creative visualisers and graphic
Big Data Infographic Report A recent report by SAP finds that the so-called power of Big Data has yet to be unlocked by decision makers. Datalabs has designed an infographic
The Most Common Type of Data Visualisations & Examples 15 Chart Types, Visualisations and How To Use Them With the growing amount and accessibility of data, data visualisation is becoming
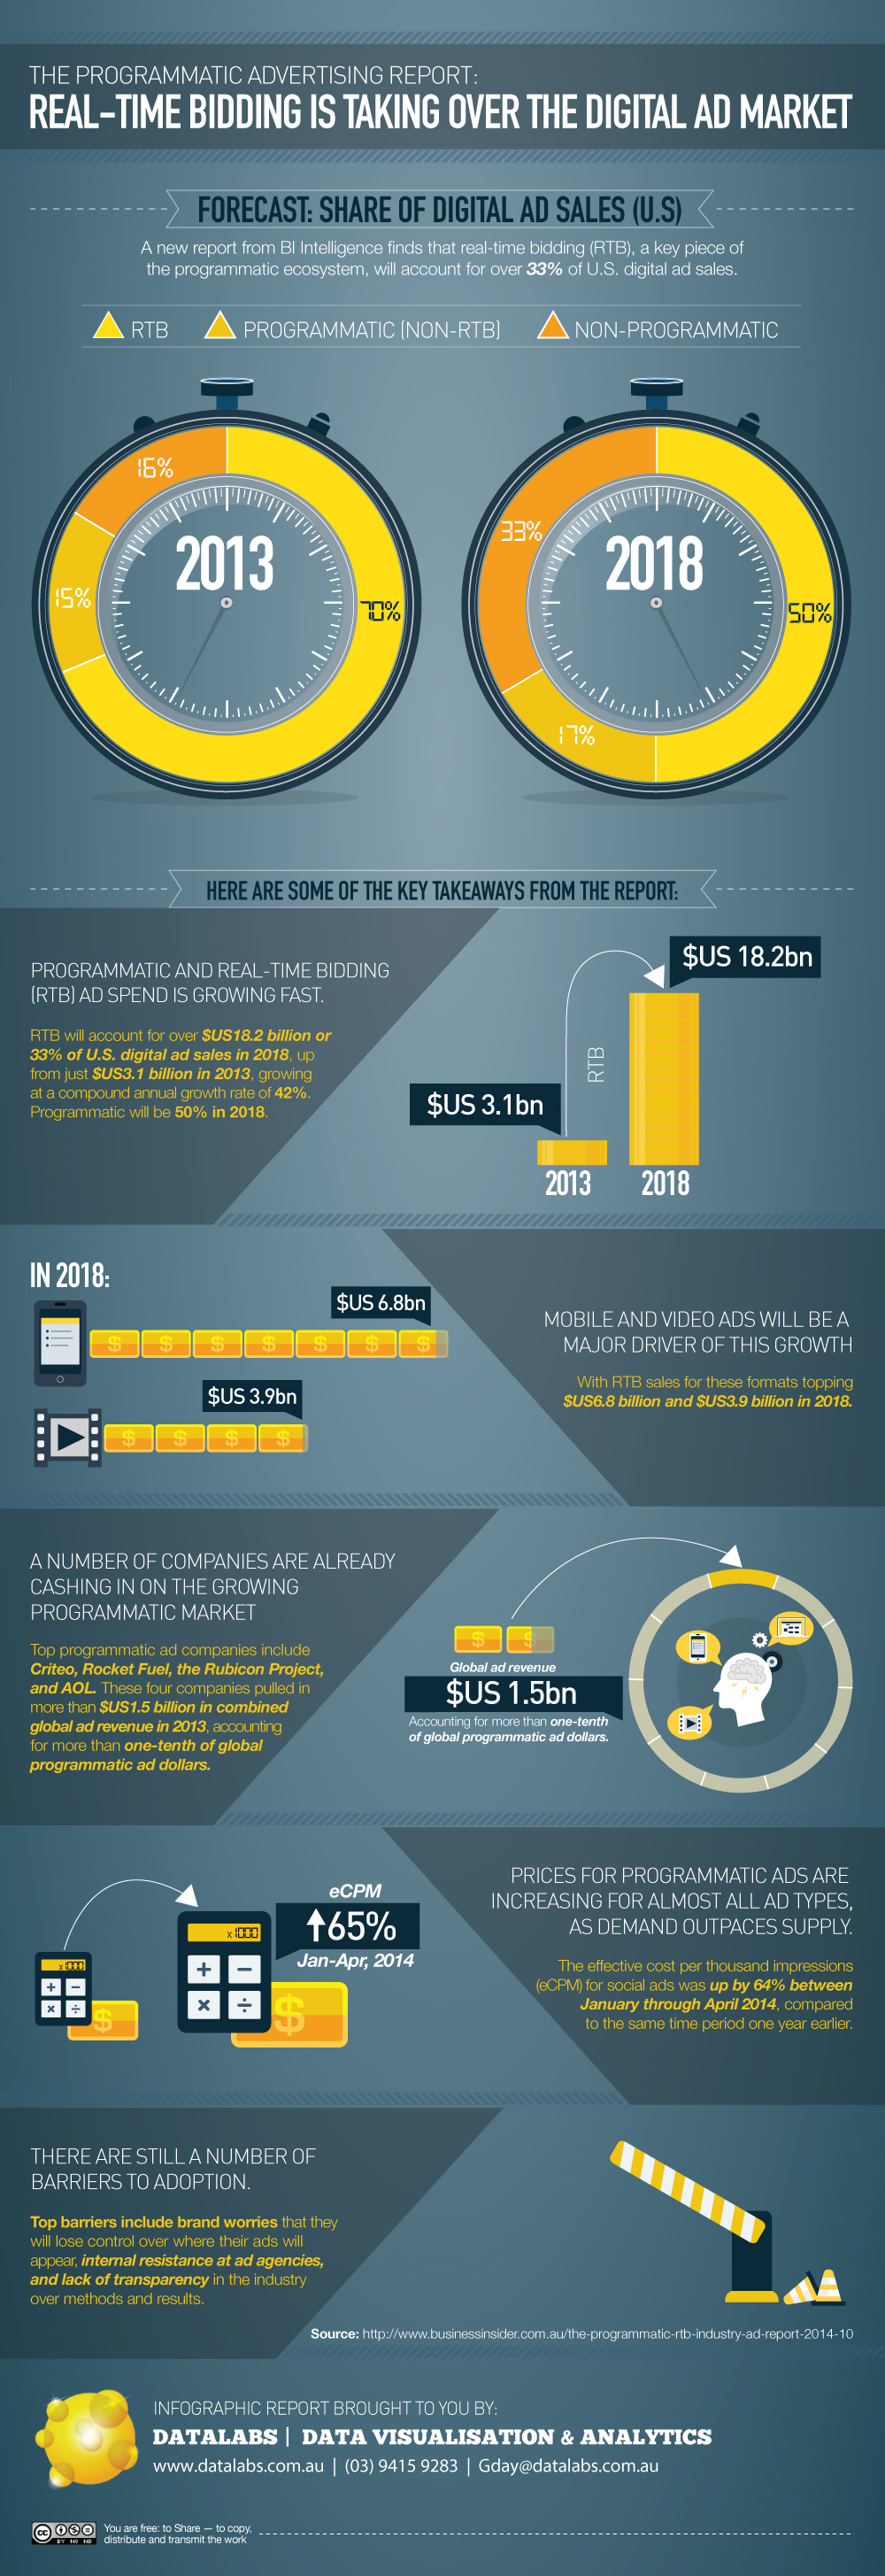
Programmatic advertising budgets are growing. The need for automation and the control of the buying process and marketing data is opening up new ways of purchasing digital advertising inventory. Real-time
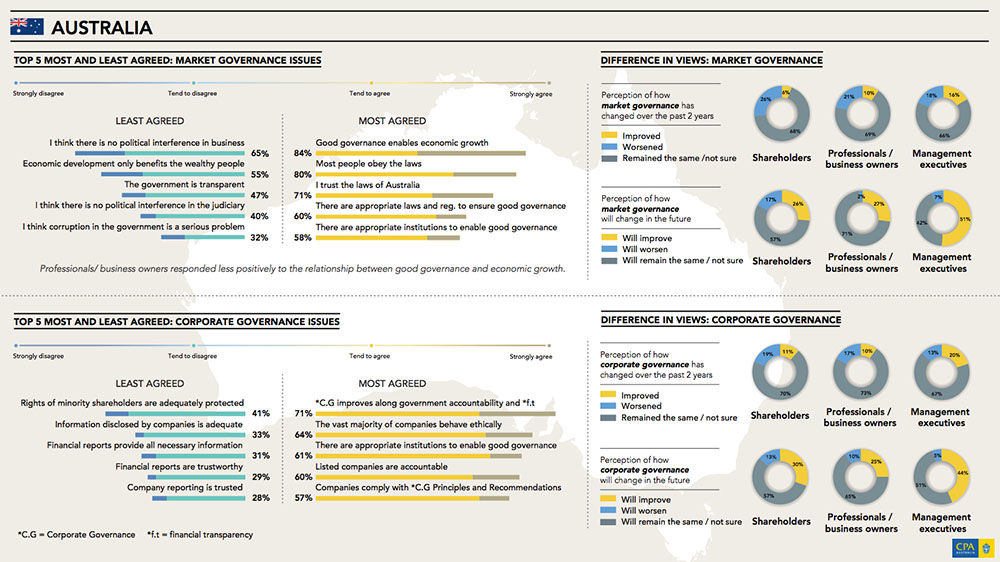
CPA Australia Infographic Reports From data discovery to design Datalabs worked with CPA Australia to distill the insights from their Corporate Governance report on the Asian Pacific Region. The infographic