

Amazon Web Services recently came out with a shiny new toy for us data enthusiasts — Amazon Quicksight. For those of you (also us) that’s already used to existing popular software such as Power BI or Tableau, this newcomer is also up there and isn’t to be missed.
From their website, Amazon QuickSight claims to be “a fast cloud-powered BI service that makes it easy to build visualisations, perform ad-hoc analysis, and quickly get business insights from data.” Sounds pretty much similar to Power BI/Tableau? Not quite. Let’s get to it in more detail, shall we.
Amazon QuickSight Features
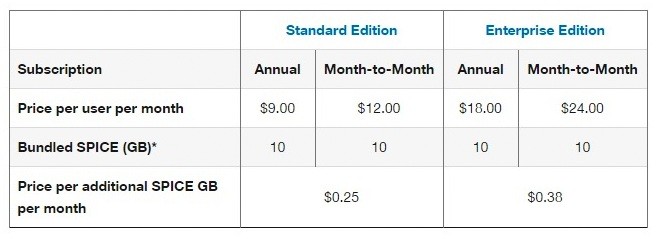
1. Pay only for what you use
It is true that QuickSight is the only software to offer per-session pricing. Currently, the Standard Edition of the software costs $9 per month on an annual contract or $12 per month sans contract. This makes it easier to get started with QuickSight, which could be a major decision-maker for smaller companies/business with lower budget.
2. Data processing → Super-fast, Parallel, In-memory Calculation Engine (“SPICE”)
QuickSight is built on SPICE, which Amazon claims to be a combination of “columnar storage, machine code generation, in-memory technologies, and data compression.” Basically, SPICE stores data until users delete it. Once plugged into the cloud, data will be automatically duplicated and scaled by SPICE. This automatic scaling enables growing organisation to scale data to large volume when needed without additional overhead. It also allows for simultaneous access to the data and fast interactive data analysis, no matter the number of users at a given time.
3. Data source compatibility
Plugging data into QuickSight is easy because it can access data from many different sources. Built-in support is available for Amazon Aurora (Amazon’s own cloud database), MySQL, SQL Server, Kinesis, DynamoDB, Redshift, RDS, Oracle, S3, and even file sources, among others.

4. Portability
QuickSight is as handy as it gets — can be accessed anywhere from laptop, desktop, tablets, smartphone, and even offline. All you need to do install the app and log in. Easy!
Picking the right BI option
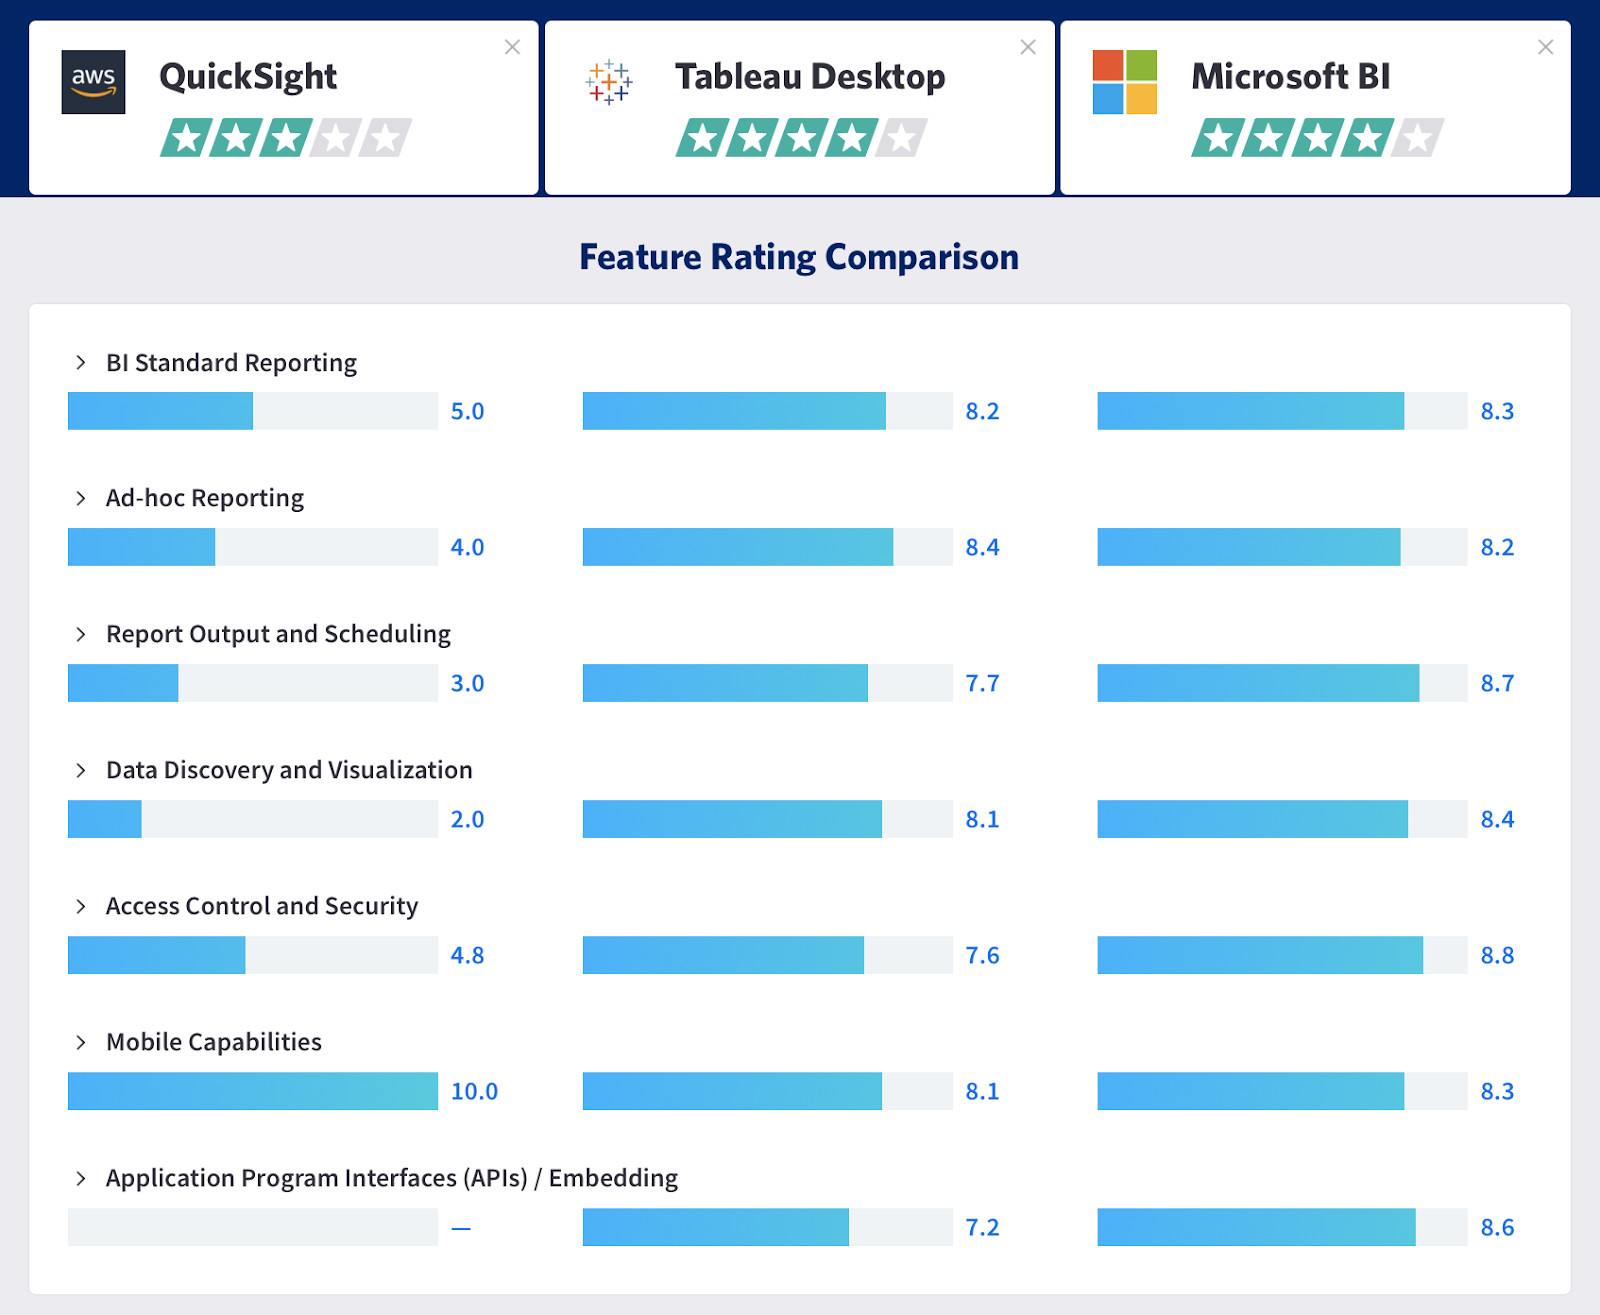
Now moving on to discussing if QuickSight actually delivers their promises. The table below shows user ratings of QuickSight, compared to Tableau and Microsoft Power BI (taken from TrustRadius).
Talking about differences, QuickSight is definitely in its infancy and have major areas to improve on. For instance, QuickSight is still lacking pre-built visualisation formats such as heatmaps, scatter plots, etc. and the ability to do geographic visualisation. QuickSight also needs to improve on its multiple access permission levels (the ability to create, read, delete) and role-based security model.
By all means, QuickSight’s features has its plus points, but still has room for growth. This doesn’t mean QuickSight falls pale in comparison with pre-existing BI tools. To pick which option of BI platform to use is a matter of evaluating your data visualisation needs.

The following should be your areas of concern when evaluating which BI platform to use!
1. Data sources
It is important to investigate whether your BI platform of choice is compatible with the type of data file you have and is able to read it. On that note, it is also good to know if the platform can process data on the fly or if it has to import the data into its own storage system. If so, what’s the speed of import – fast/slow? How much would extra data storage cost?
2. Analytics power
Depending on the data, sometimes it is better presented in a certain chart type (e.g. geographical data would be best presented in a geographic visualisation rather than numbers on a table). Thus, it is important to know if the platform supports the intended chart type for the data on hand. In terms of this, QuickSight is still rather lacking.
Besides chart type, depending on the experience level of the user, platforms that can provide analysis support in terms of simple statistics or have built-in intelligence for analysing common data patterns would be easier to use.
3. Collaboration options
Exactly what can be shared differs platform to platform. Can you only share charts with fully-licensed users, read-only registered users or unregistered users as well. Can read-only user sort and sift through the data or can they only view it from a slideshow made out of the data (in which some platforms only allow).
4. Price point
This could be a major point in picking which BI platform to use. Depending on the budget, it would be more economical to pick a cheaper BI platform that fulfills a minimum need for data visualisation despite not containing fully-fledged features, rather than signing up for a year contract of a cutting edge BI platform that proves to be rendered quite useless. QuickSight is superior if you’re looking for a good BI software that is on the cheaper side for short-term use.
—
So there you go — a quick primer on QuickSight (ha!). No BI option is “the best”. It is always a case by case basis on what’s best suited to your needs. Any questions? Thoughts? Concerns? We love discussing data viz with you! Shoot us a message and we’ll be in touch.