';

Tableau Business Intelligence Dashboard Designer

Designing the World’s Most Beautiful and Effective Tableau Dashboards

Image module
Innovative, Infographic Tableau Dashboard Design That Will Change The Way Your Business Does Analytics & Reporting

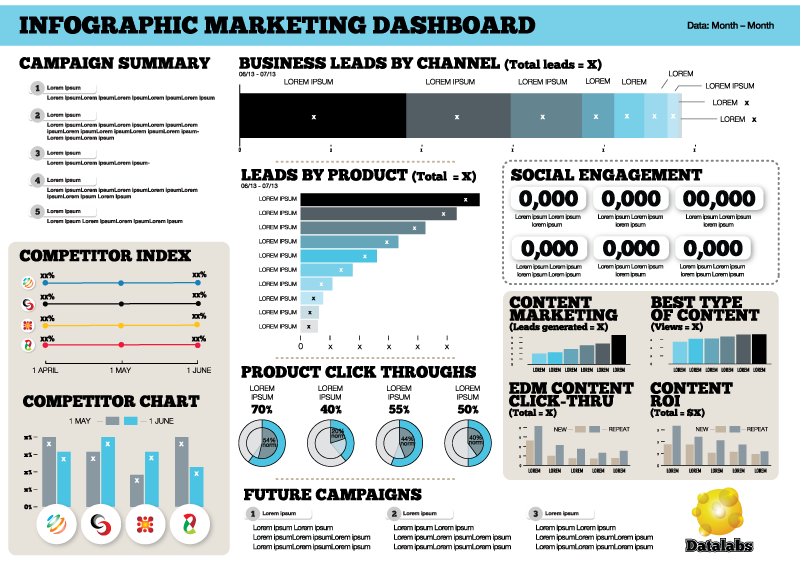
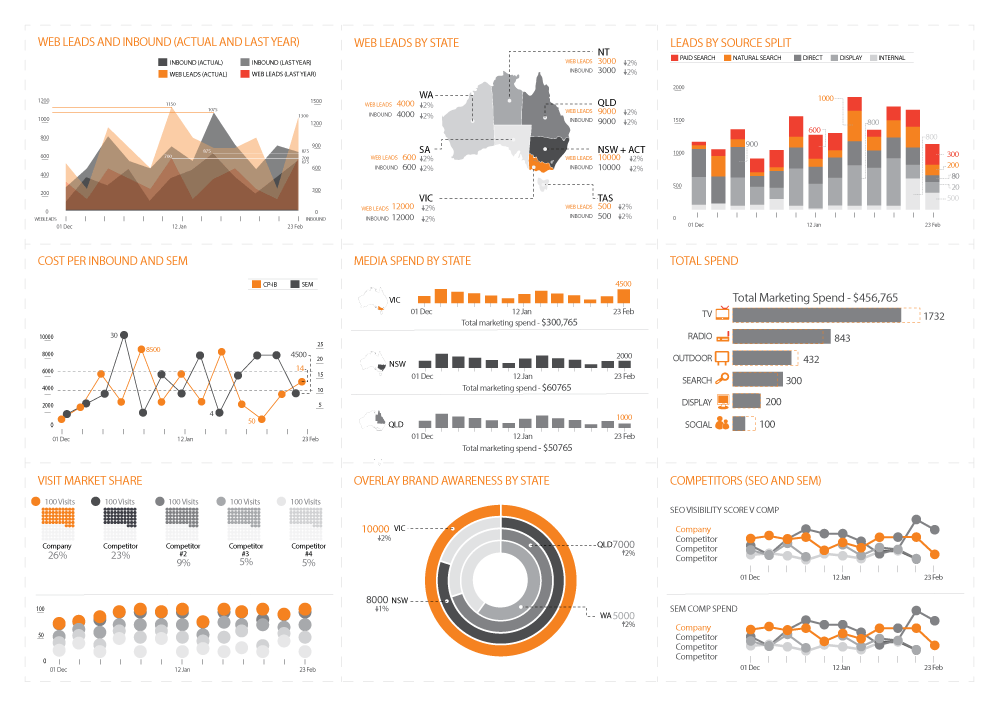
Business intelligence dashboards or BI dashboards from visual analytics designed in software like Tableau are replacing Microsoft Excel. That’s because business intelligence dashboards foster quicker, more insightful decisions. Employees have the data at their fingers. And not always just at their desks.

Sales meetings can focus on visualised data by regions, by teams, by-products. Imagine this: your business’ analytics in real-time, anywhere in the world with an internet or mobile connection, receiving up-to-the-minute data on key insights – whether it’s sales, sign-ups or purchases. This is the new norm.

If you’d like to see a live Tableau Reporting Project, click here. If you’d like to see a dashboard case study, click here.

Want To Know If We Can Help?
Operations, Tactical and Strategic Dashboards In Tableau

A vital component of any data-driven culture, well-designed dashboards streamline and democratize business-critical data. There’s no gatekeeper. Those that are assigned access to the dashboards receive the data. No longer is there a sole entity or personality controlling the flow and communication of your data. That kind of transparency fosters a culture of accountability that smart businesses thrive on.

Lastly, our Tableau BI dashboards keep your data secure. Hosted in the cloud, your data is encrypted and safe.

Image module
Tableau Dashboard Designers & Developers

Datalabs’ dashboard developers work with the some of the best analytics dashboard software available, but we’re experts in Tableau dashboard design and development. Whether you’re interested in discovering what business intelligence dashboard tools can do for your business, are looking for a Tableau dashboard designer, or want to have a consultant work with your team to develop visual ideas and map out your dashboard requirements, Datalabs can help.

Image module
Why Datalabs?

Datalabs design dashboards with a methodology that starts with a whiteboard session that can get all stakeholders in a room and on the one page. We then create paper prototype designs, that can quickly develop a visual reporting style unique to your business and help solve your visual reporting problems.

We design dashboards that focus attention on key elements, business drivers, actionable outcomes and the ability to make decisions with the data you have. We start by simplifying your data, organising your reporting and moving your data into a dashboard that has action as the takeaway.

The Best Of Visual Analytics Dashboards & Data Visualisation Techniques

If you like what you see, click the button below to start the conversation about how Datalabs can make your Tableau dashboard that looks amazing, simplifies your reporting and becomes the focus of a data-driven, visual organisation.

Contact our development team to give you and your employees beautiful dashboards, ones that you’ll love looking at every day.

Image module
Example Uses for Tableau Dashboards

Employee KPIs
Advertising Campaigns
Sales Dashboards
Social Media Dashboards

Content Marketing
CEO Dashboards
Political Polling
IT Metrics
Financial Reports

Sports Statistics
Social Media Monitoring
Real Estate Maps
Geographical Sales

Image module
More Detail

Get in touch with us and let’s talk about how we can help get Tableau working for you.