Infographic report design – visual documents presenting data and insights quickly and clearly – are a key driver of engagement for anyone trying to understand a complex dataset. Infographic reports tell a simplified and beautiful story, contextualising relationships, scale, distribution, and proportions in business data.
Infographic Reports & Infographic Design
Infographic Design: Data-Driven Reporting to Visual Storytelling
Communicate complex data quickly and effectively through visualisation with infographics

A Suite of Data-Driven Infographic Reports
Infographics or infographic reports are used to visually present a company’s or government organisation’s key ideas and insights. By using basic principles of design to support the data, we are able to make it more easily accessible to a larger audience of stakeholders. And we won’t do it in a boring way. Reports, metrics, KPIs will all look better visualised in an infographic and shared internally via your companies intranet, as collateral in meetings, or used to bolster a business case.
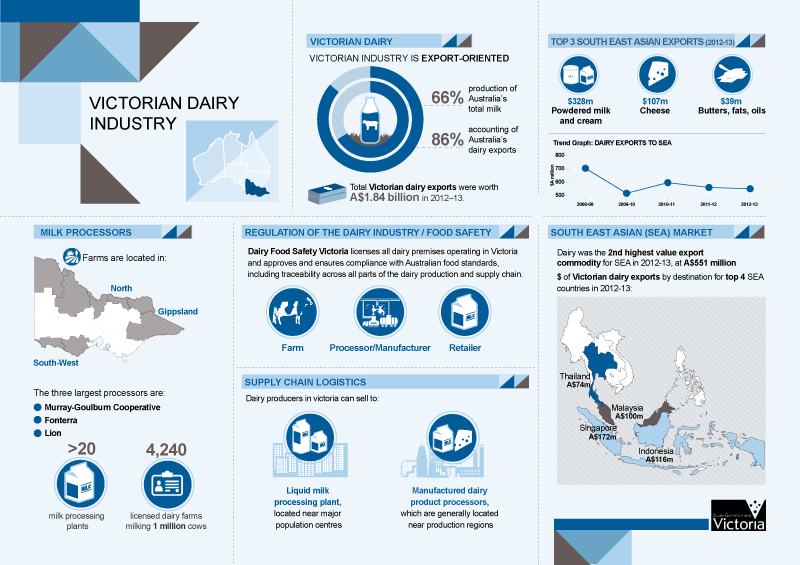
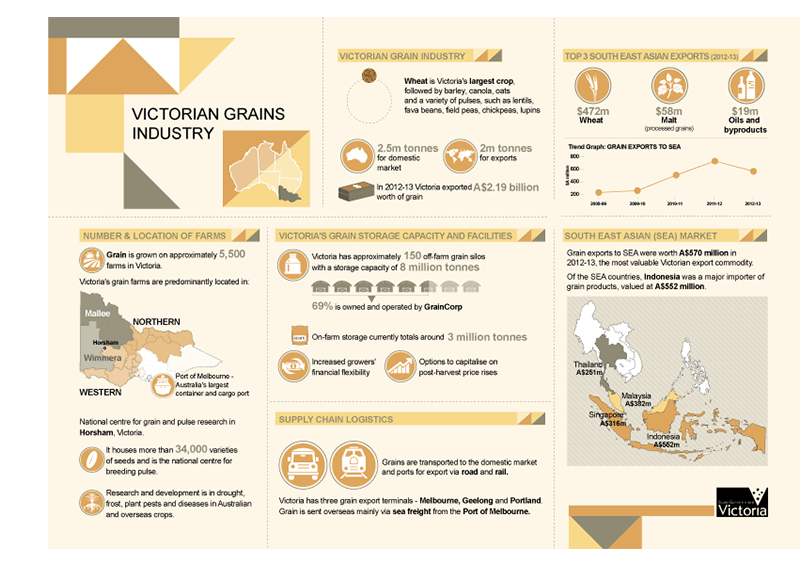
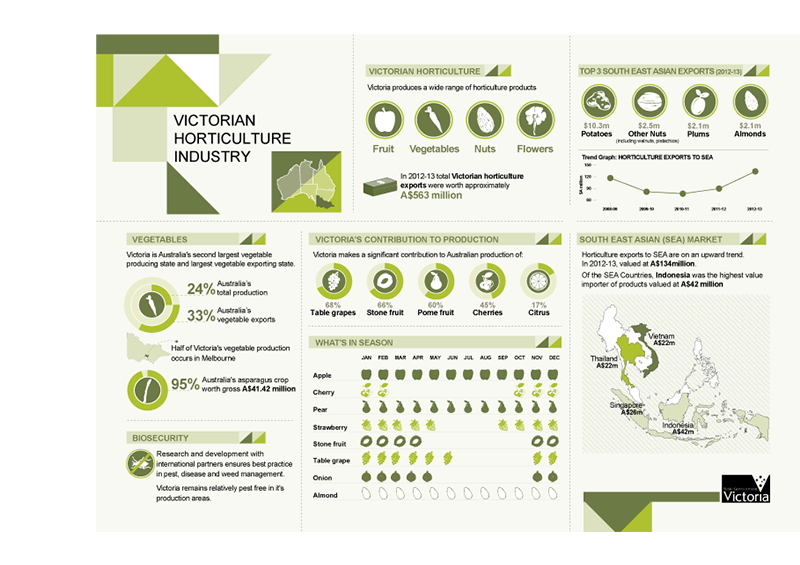
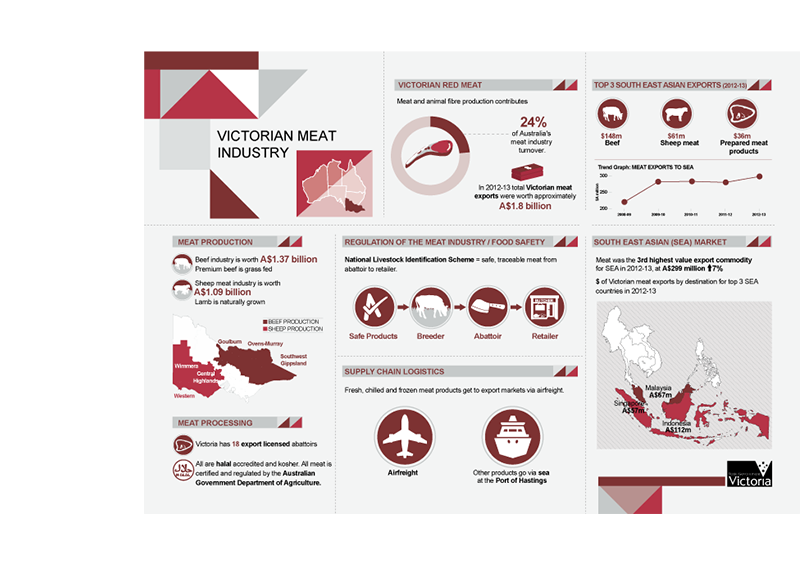
Infographic Design Examples For Australian Companies


Be different:
Don’t print out your metric or construct your next PDF report. Let Datalabs design your data in an infographic format and provide your audience with the key findings ‘ready-made’ in collateral format that can be used in additional presentations, business cases, and stakeholder discussions.
Statistics and Numbers Can Overwhelm Audiences
…and therefore lose much of their significance. When organised into an infographic format, it becomes much easier to quickly draw meaning from data. The core purpose of an infographic is to simplify a complex idea, which makes them great educational tools, especially when presenting an overview of a topic instead of an in-depth analysis.
Comparative Information Design
When drawing comparisons, infographics help organise similarities and differences that compliment the information being presented. Comparisons can be difficult to express with words, sometimes to the point of being more confusing than revealing to the audience. By presenting the same information in a neatly organised infographic, comparisons become clearer.
Research & Infographic Reports
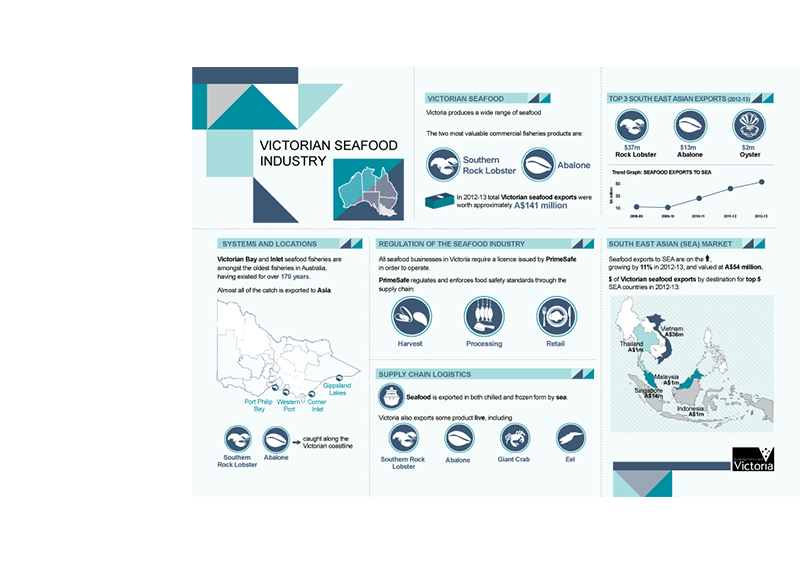
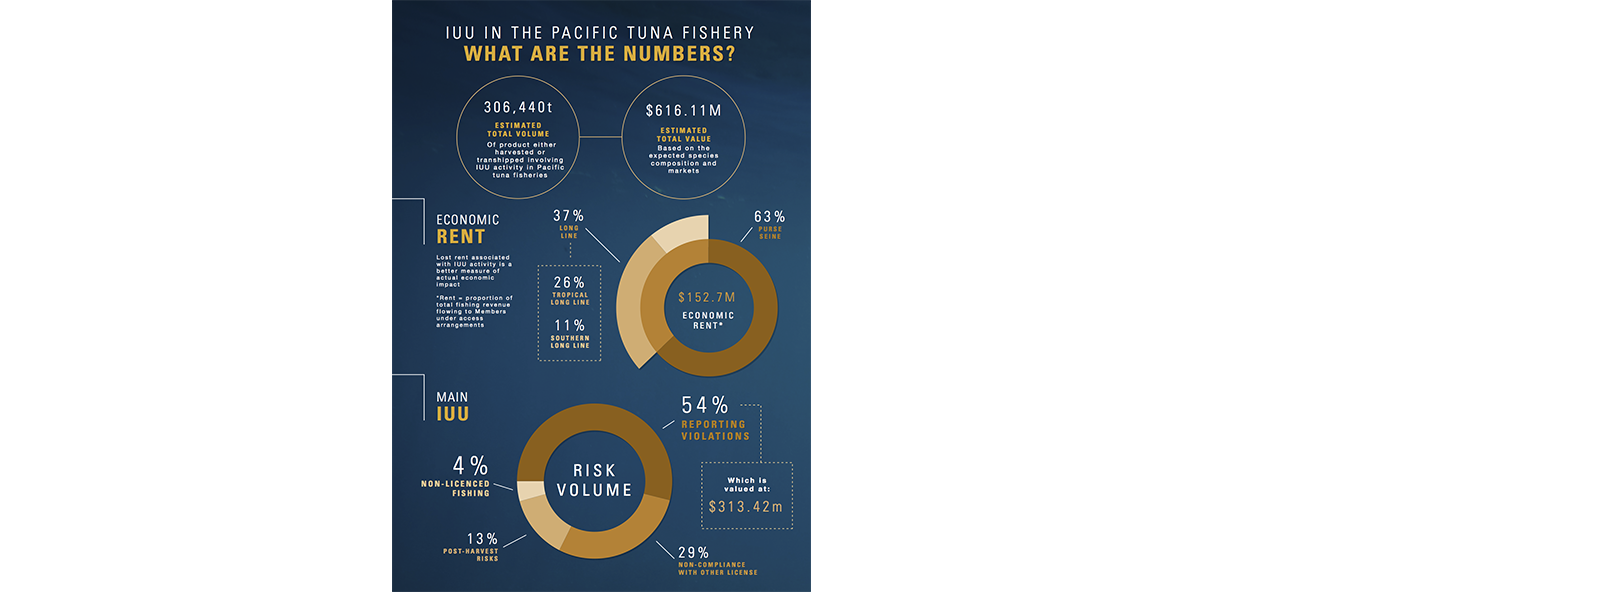
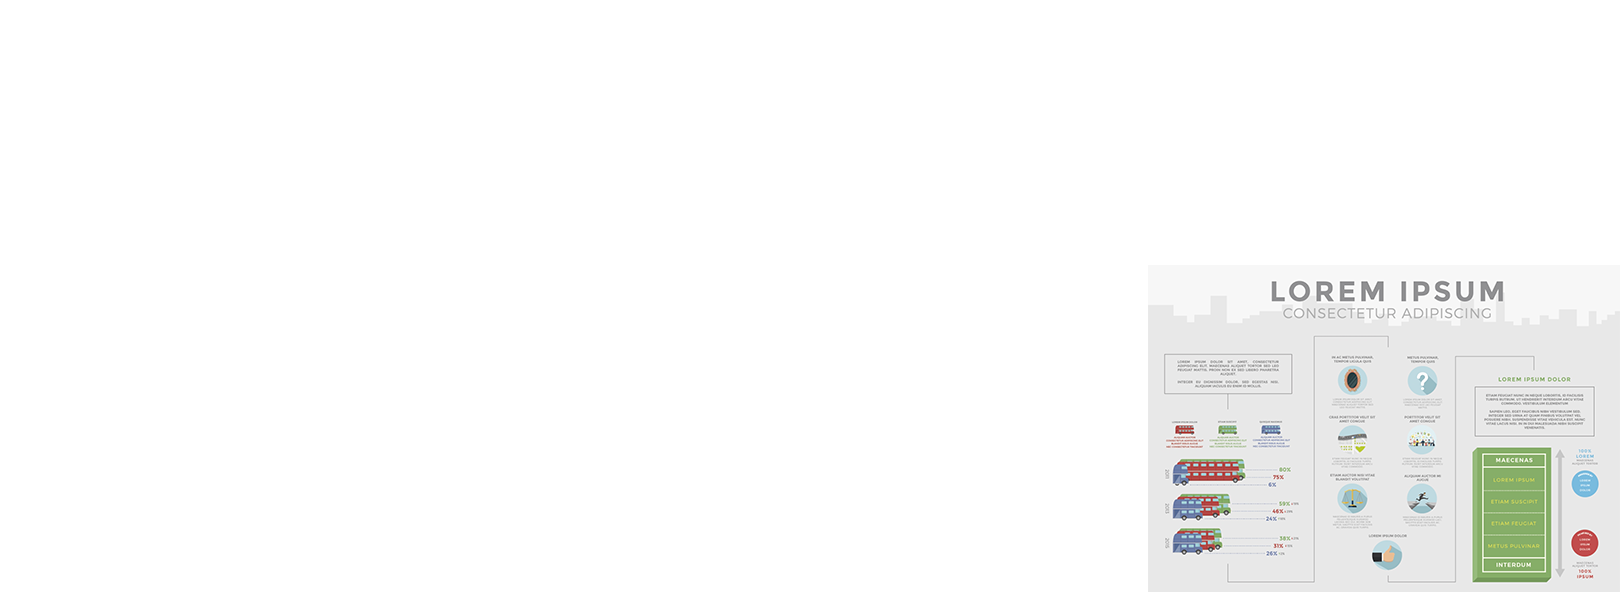
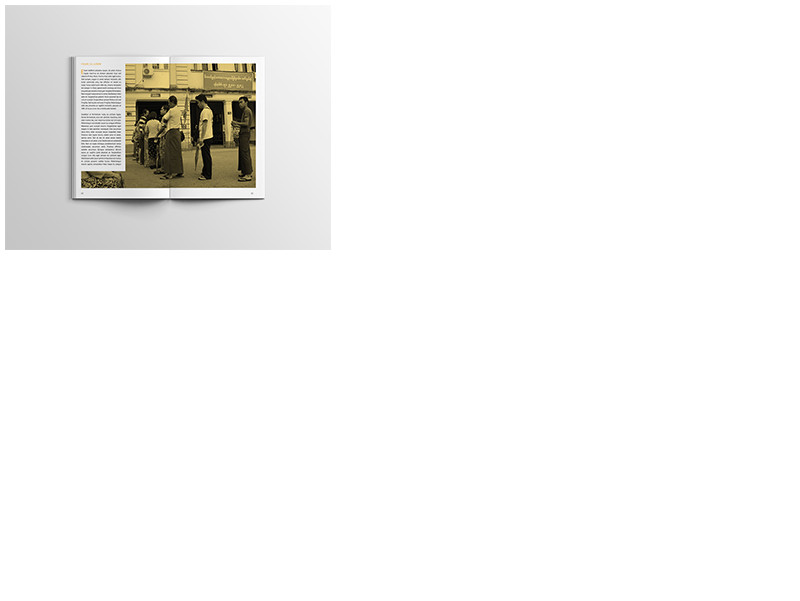
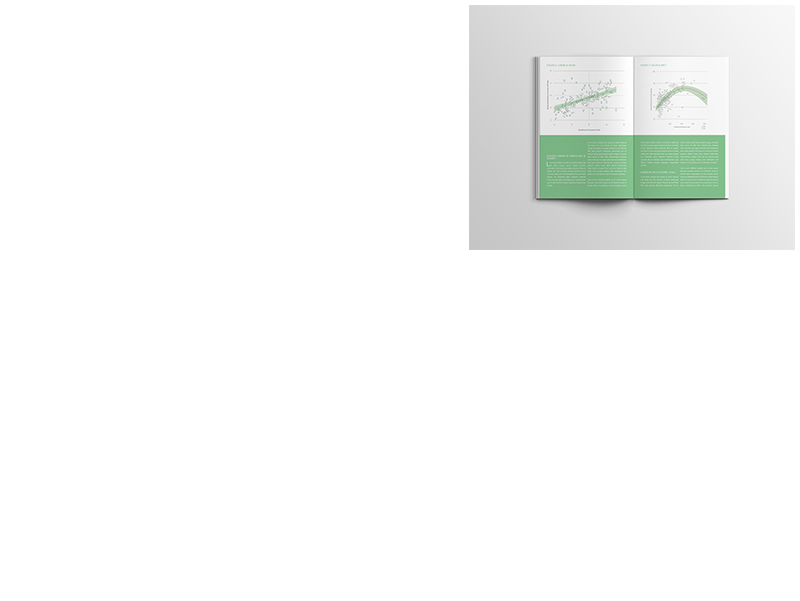
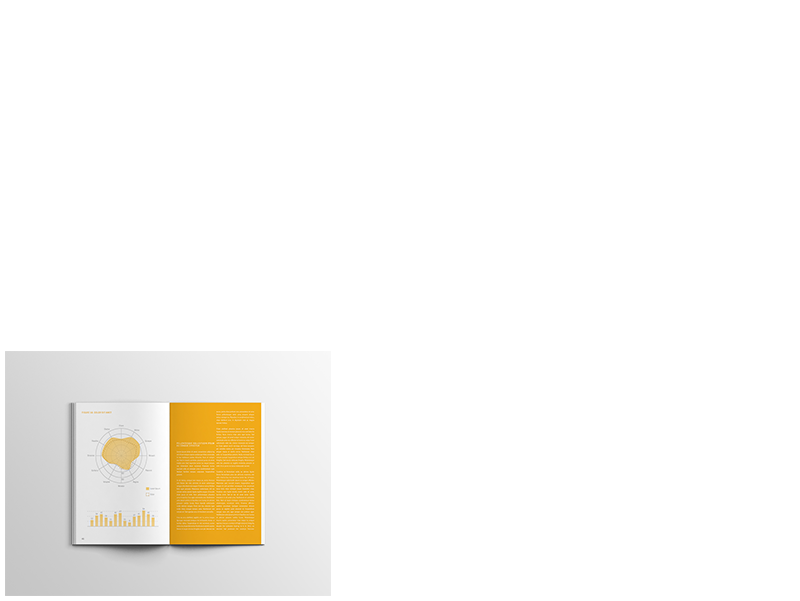
We design long-form research reports, market research reports, government submissions or annual reports in infographic style. The examples below are for an Australian university end of year summary report.


Infographic Design and Storytelling for Business
Infographics for business purposes, or infographic reports, combine storytelling and design with data science and commerce. Knowing your audience and how they understand stories and visuals is important to communicating your business insights. Contact Datalabs to convert your spreadsheets into infographics.
Technical Specification of Our Infographic Reports
Our infographics are designed to support or replace your existing business documents. Print them or share them digitally. Infographic reports can be generated as hi-res PDFs or as JPG, GIF, and PNG images.


More Detail
Get in touch with us and let’s talk about how we can help you with your infographic project.