Rabobank is a Dutch banking and financial service provider which began by farmers supporting their businesses and rural communities gain access to fair financing. In October 2019, Rabobank supported themselves once more by gaining access to learn good data visualization and storytelling, plus Power BI.
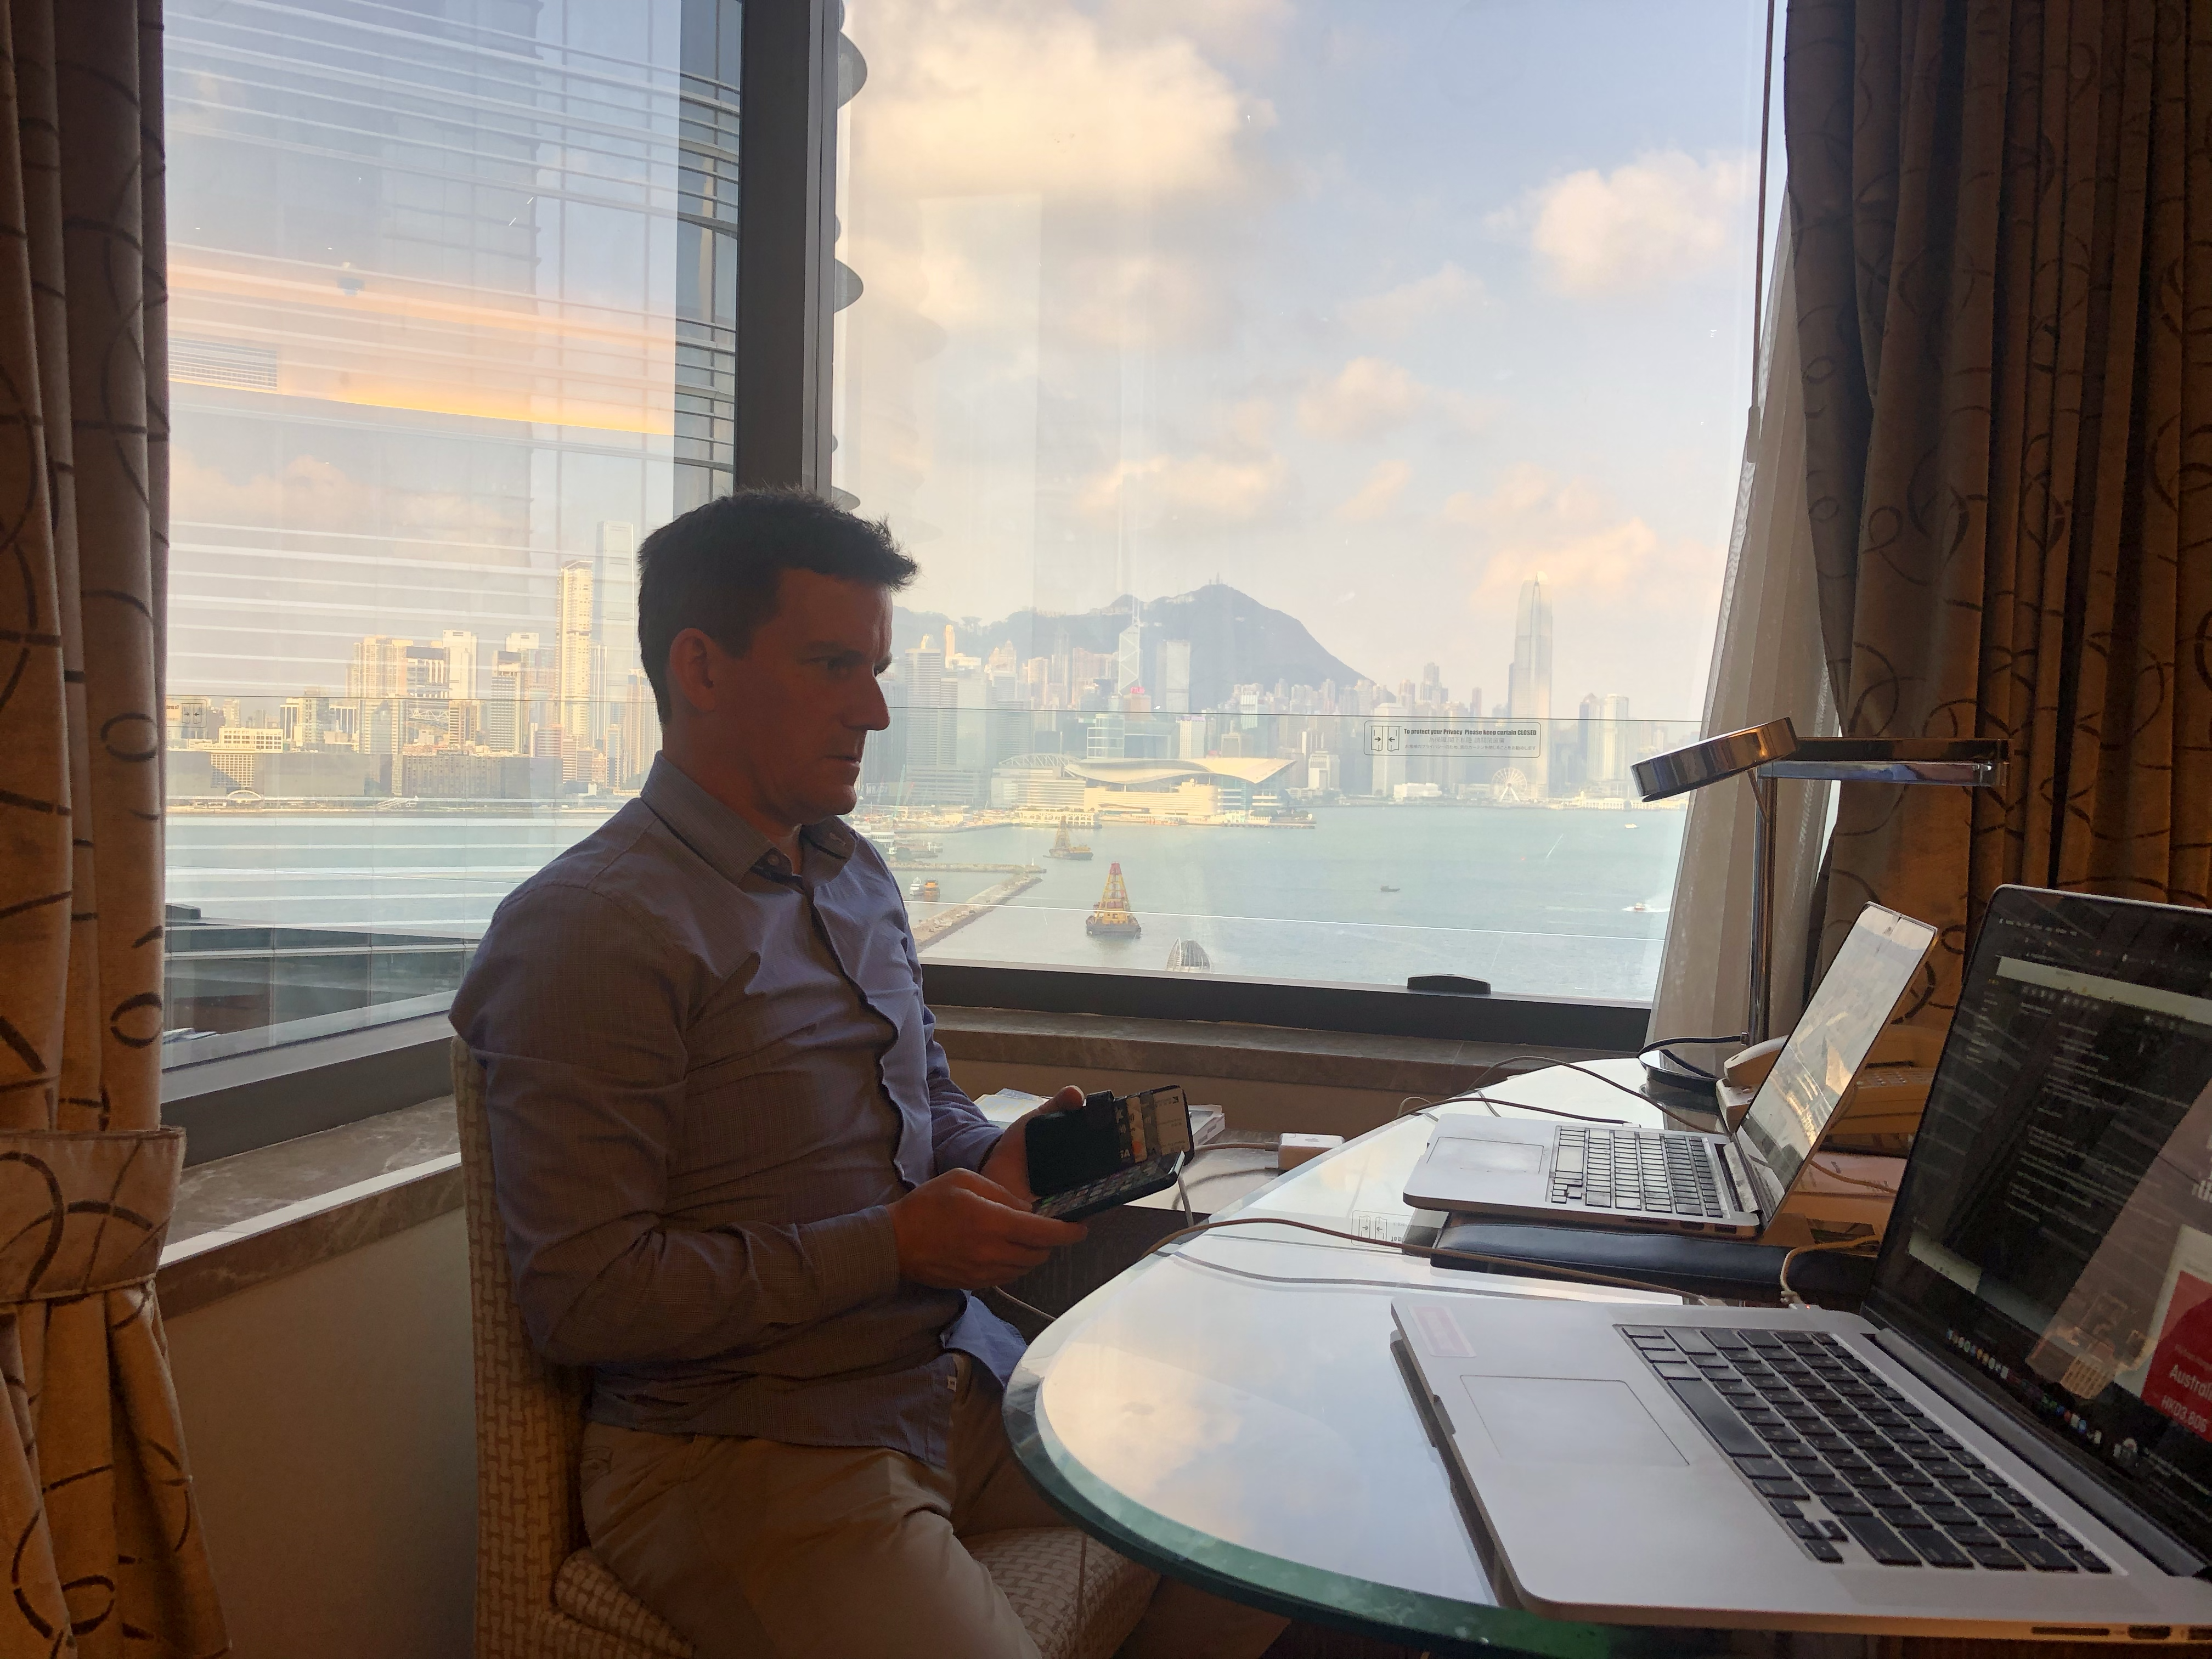
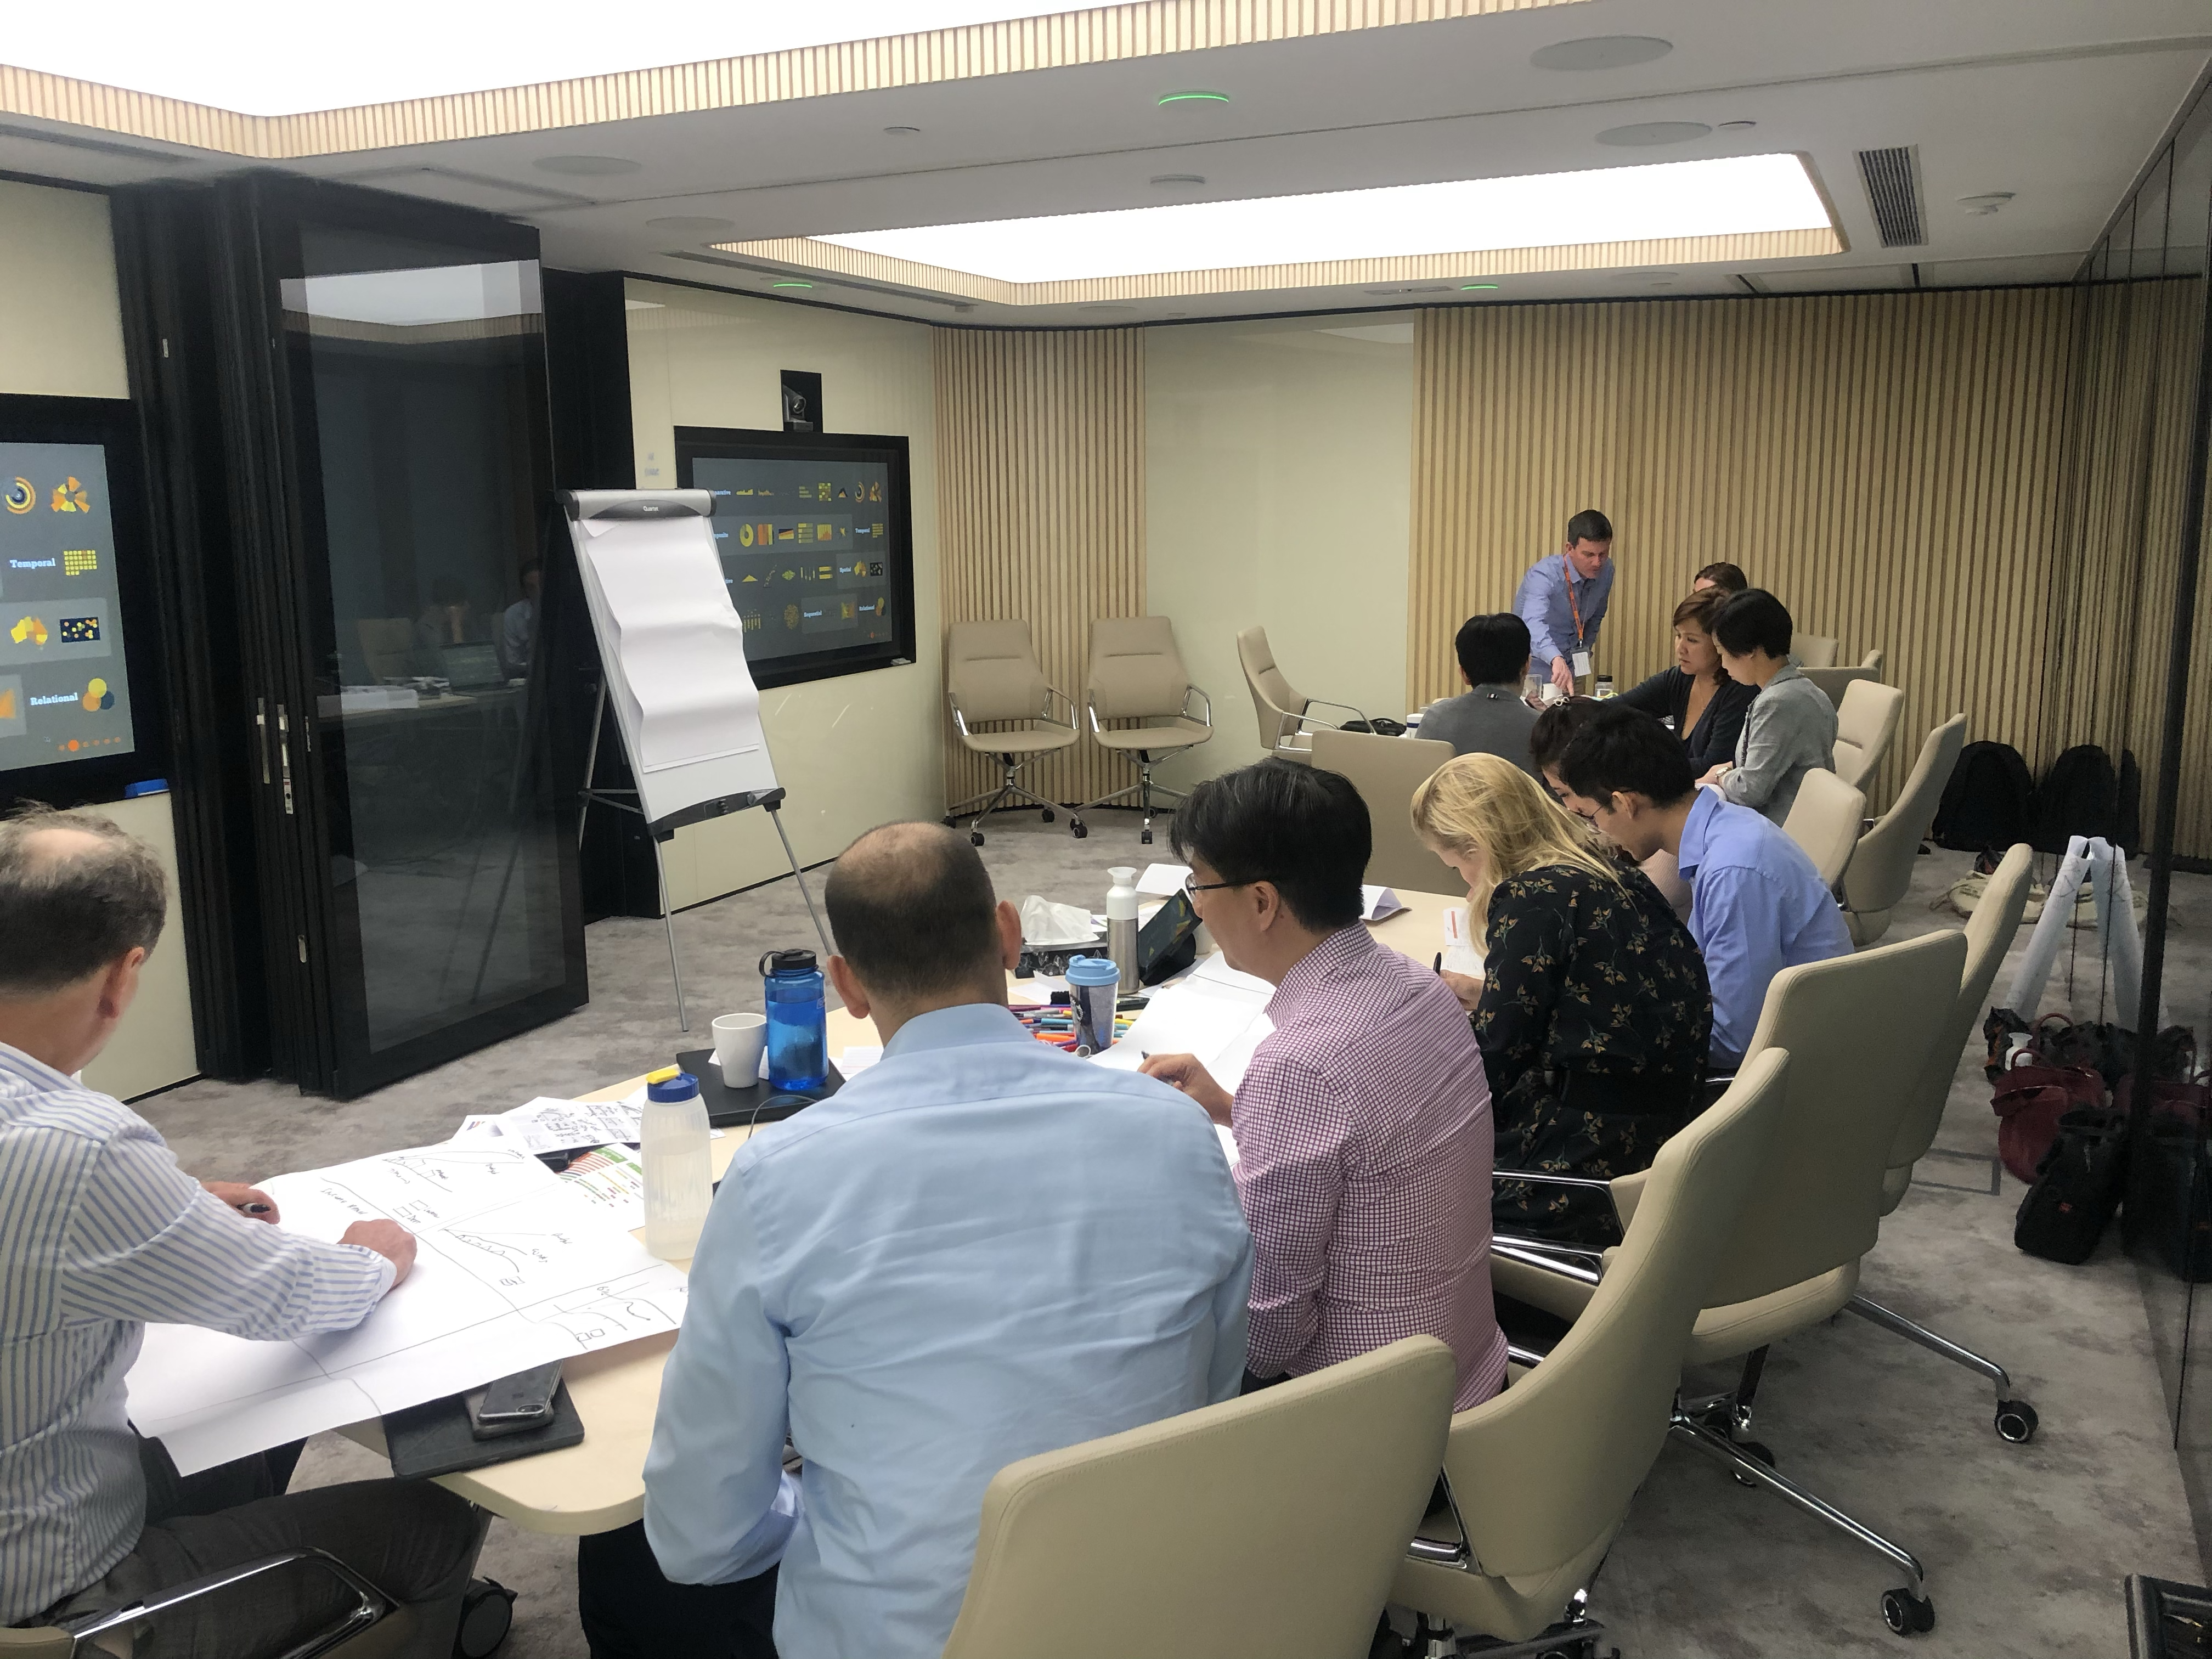
Two key members of the Datalabs team flew out to Hong Kong with our suitcases packed with collateral specifically curated for Rabobank. We began with an initial kick-off discussion, where we understood that people to be in attendance were predominantly in Finance and Human Resources. Therefore, we requested data reports from both departments to assist in our tailored teaching and learning outcomes. The results of an exercise to re-visualize these reports were outstanding. This was achieved through applying what was had been explained prior, including layouts, chart usage, narrative, and of course, just getting it onto paper!
From designing and exercises, we moved our attention to Power BI. This is one of the BI tools we prefer as it is capable of producing beautiful dashboards and reports, plus it is very progressive with a constantly developing inventory to assist in data viz. Once the workshop concluded, we had some one on one discussions, where we geeked out on Power BI and chatted about the day. One of our favourite parts of the workshop. From there we headed out into the streets of Hong Kong, to reflect on the day amongst the skyscrapers and wonderful views surrounding the finance district.
If you’ve read this far, I’m taking it you may be interested in a data visualization workshop of some sort? Well, we are always very happy to have a chat via phone or email to provide you with more information on making those steps yourself in becoming a great data visualizer.


