

Data Visualisation Tools: A Curated List
Originally published in mid-2012, the visual list of data visualisation tools, curated by Interactive Things, is still a valuable resource.
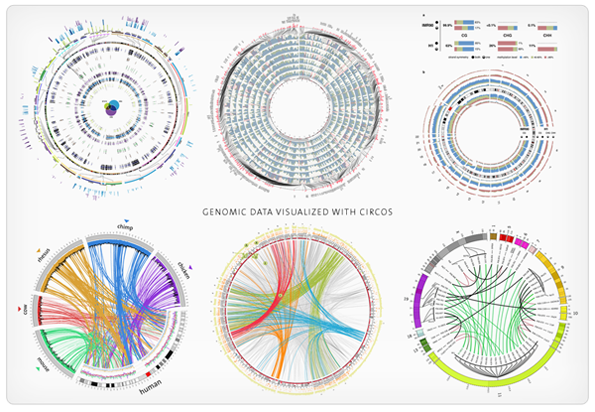
All the JavaScript libraries are there. The niche visualisation tools that handle hierarchical graphs (Gephi), circular Visulaisations (Circos), and timeline series (Envision) are also represented. All software and code are oraganised by tags: “maps”, “charts”, “data”, and “color”.
Bookmark this page and refer back to it for inspiration, as visual reference sheet, or for the solution to your next data visualisation problem. We do.
View the data visualisation tools:
Data Visualisation Tools: A Curated List