The Datalabs Agency has NEWS! Hello, data friends! Click here for the “Introduction to Data Visualization & Storytelling Course”. We’ve been working hard behind the scenes, and are now super,
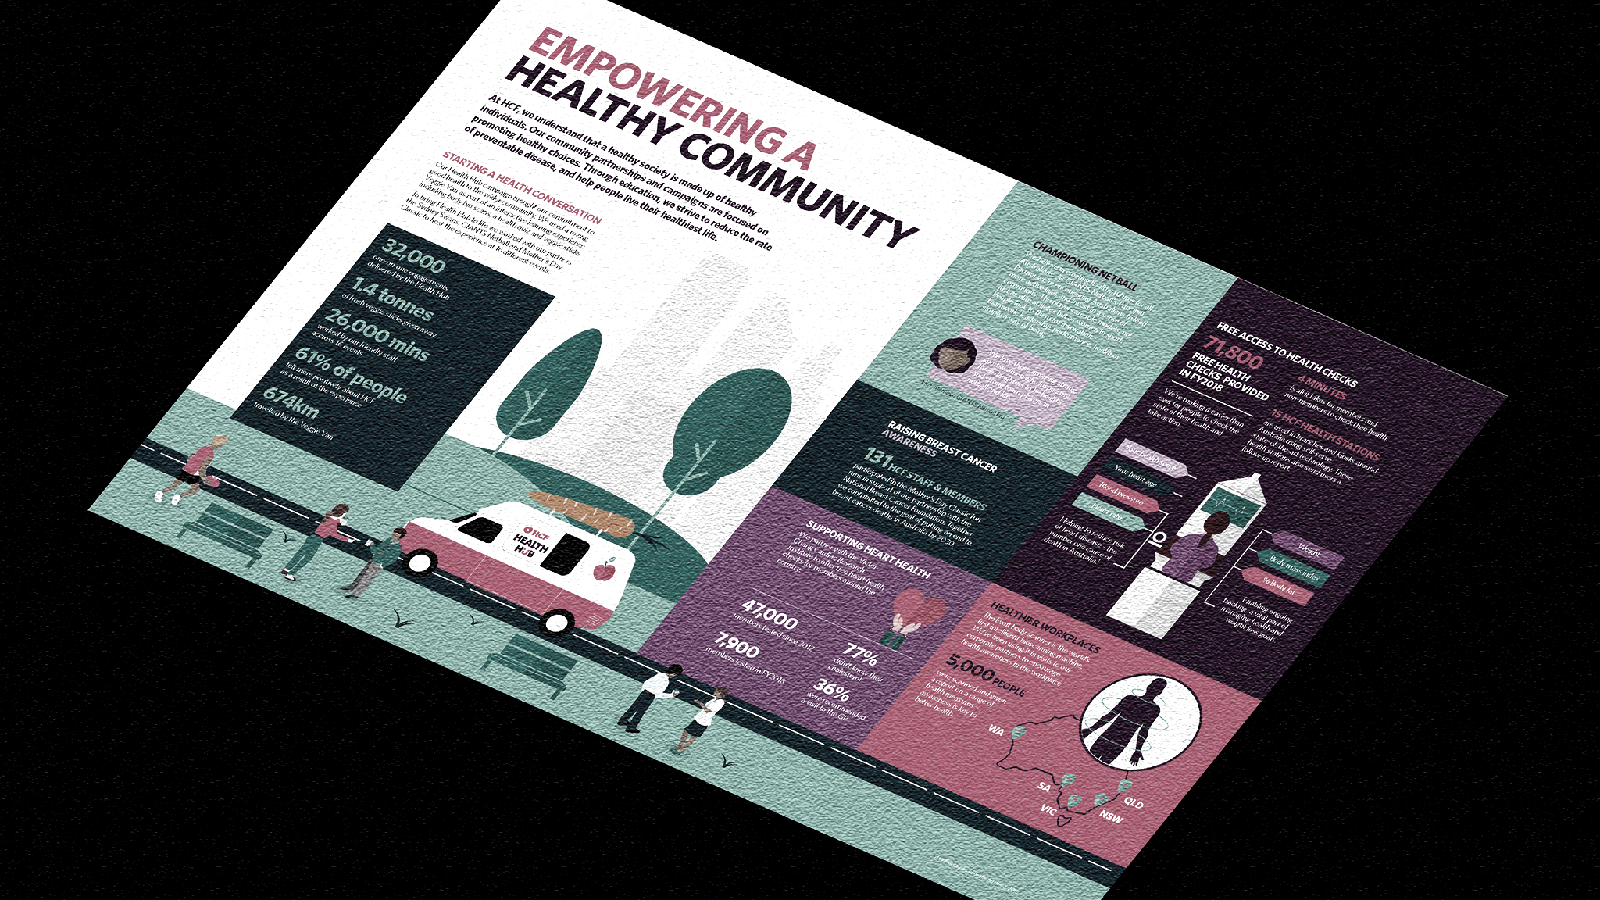
So we made an infographic. Like what you see? Get in touch to talk about your project Contact us here

We have come to the end of our Data Design Principles series. In this final post, let’s ask the most basic question – what exactly is data viz? (ha, rhyme

Top 5 Data Viz Trends in 2018 If you’re wondering what we can expect in data viz this year, you’re in the right place. When it comes to data visualisation,

Your Guide to Marketing Conferences in 2018 It’s going to be a big year…

5 Advantages You Can Only Get From a Data Viz Workshop Have you heard? We’re running our first ever open-to-the-public dashboard and report design workshop – and you’re invited. When
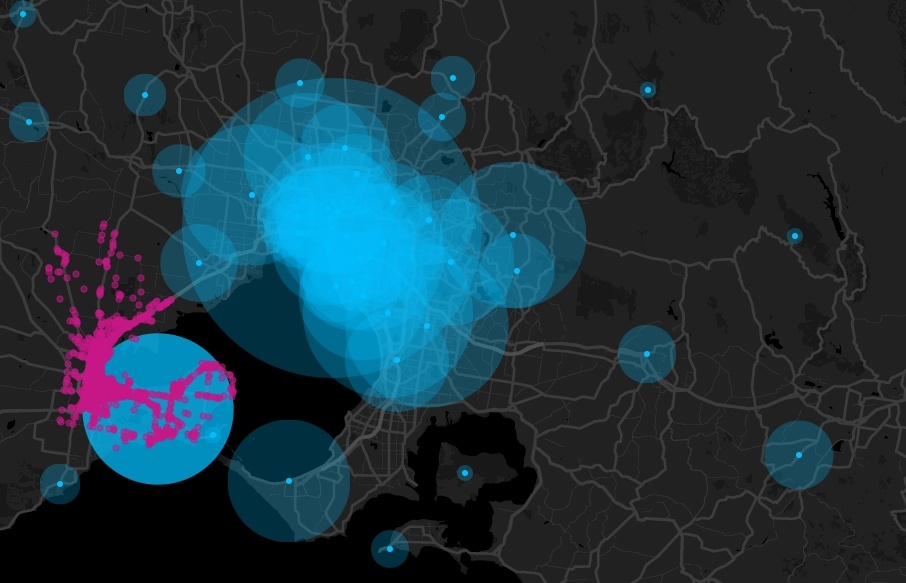
Our Top 5 Interactive Visualisations Want to be inspired? Here are the best interactive data visualisations we have ever seen… Humans are visual creatures. We respond to visual data better
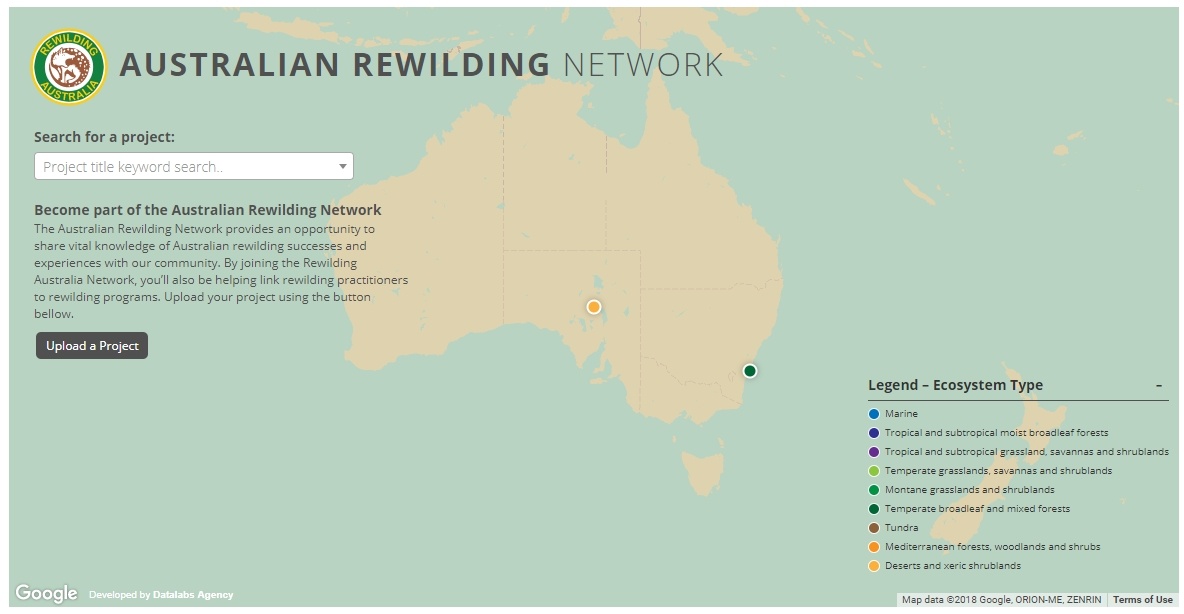
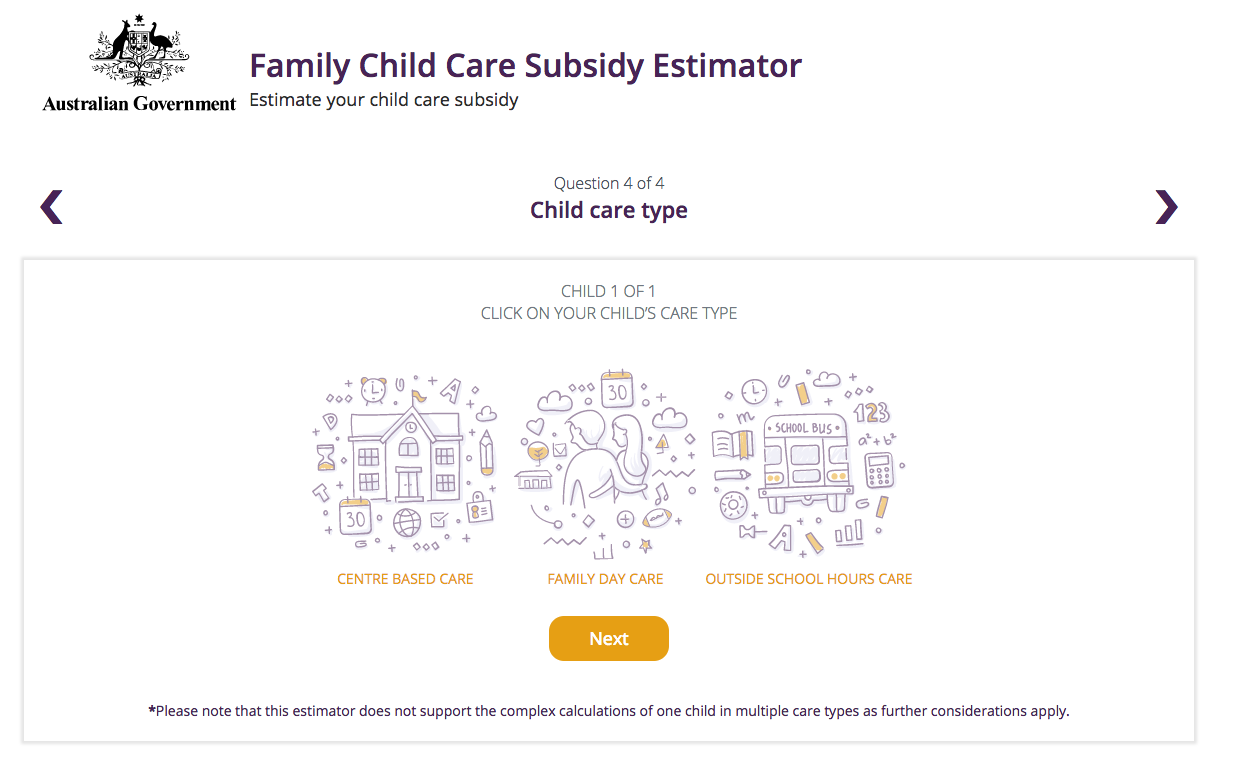
Case-study: Department of Education and Training Interactive Child Care Subsidy Estimator When: June-August – Initial 2-week development-to-delivery phase, then updates and revisions.