Our List of Data Analytics Conferences for 2017 In today’s Age of the Internet data is everywhere – and every day brings more data. In fact, the amount of data readily

Do you know what your digital marketing system looks like? Like, physically, looks like? Imagine a network of veins, valves, and organs — all labelled for clarity, informing everyone who
Our List of Data Visualization Conferences for 2017 With Christmas decorations now flooding department stores, we figured it was time to update our list of data visualization conferences and events

Australian data visualization and analytics company, The Datalabs Agency, has announced its expansion into the U.S. market, opening an office in Los Angeles in early September. According to its Managing
Our List of Data Visualisation Conferences for 2016 *Update November 2016* We’ve updated this list for 2017’s conferences. Click the link to see the best data visualisation conference for 2017.

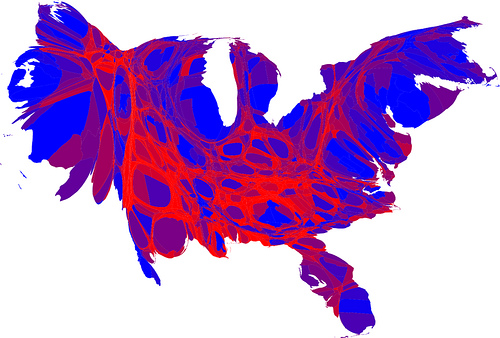
5 Captivating Information Visualization Examples Beyond Infographics, Charts & Graphs Thanks to the ubiquitous infographic, most people are well-acquainted with information visualization. But infographics aside, we believe the field of

What Makes for Great Data Visualization and Why? Data visualization can be a powerful way to communicate. When done right, it delivers information with both the weight of respected research,

Data visualisation is a powerful way to communicate new and complex information – When done right, it can deliver your message with both the weight of respected research, and the
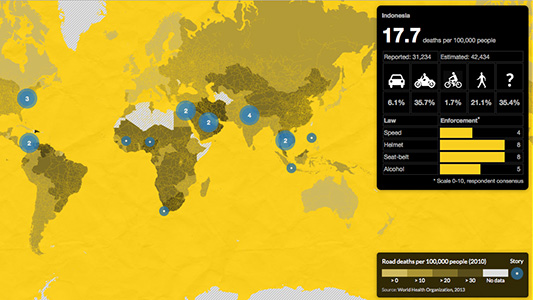
8 Incredible Examples of Interactive Data Visualisation A Curated List of Data Visualisation Ideas That Inspire Us An interactive experience blows away legacy methods like Excel and Powerpoint, software which
The Most Common Type of Data Visualisations & Examples 15 Chart Types, Visualisations and How To Use Them With the growing amount and accessibility of data, data visualisation is becoming