The Datalabs Agency has NEWS! Hello, data friends! Click here for the “Introduction to Data Visualization & Storytelling Course”. We’ve been working hard behind the scenes, and are now super,

All chief executives have one thing in common – they need more TIME. There never seems to be enough hours in a day! Between meetings, conference calls, replying to emails

As smart algorithms, artificial intelligence and machine learning applications are finding its way into our daily lives, they are no longer mere concepts, but a growing reality. From facial recognition
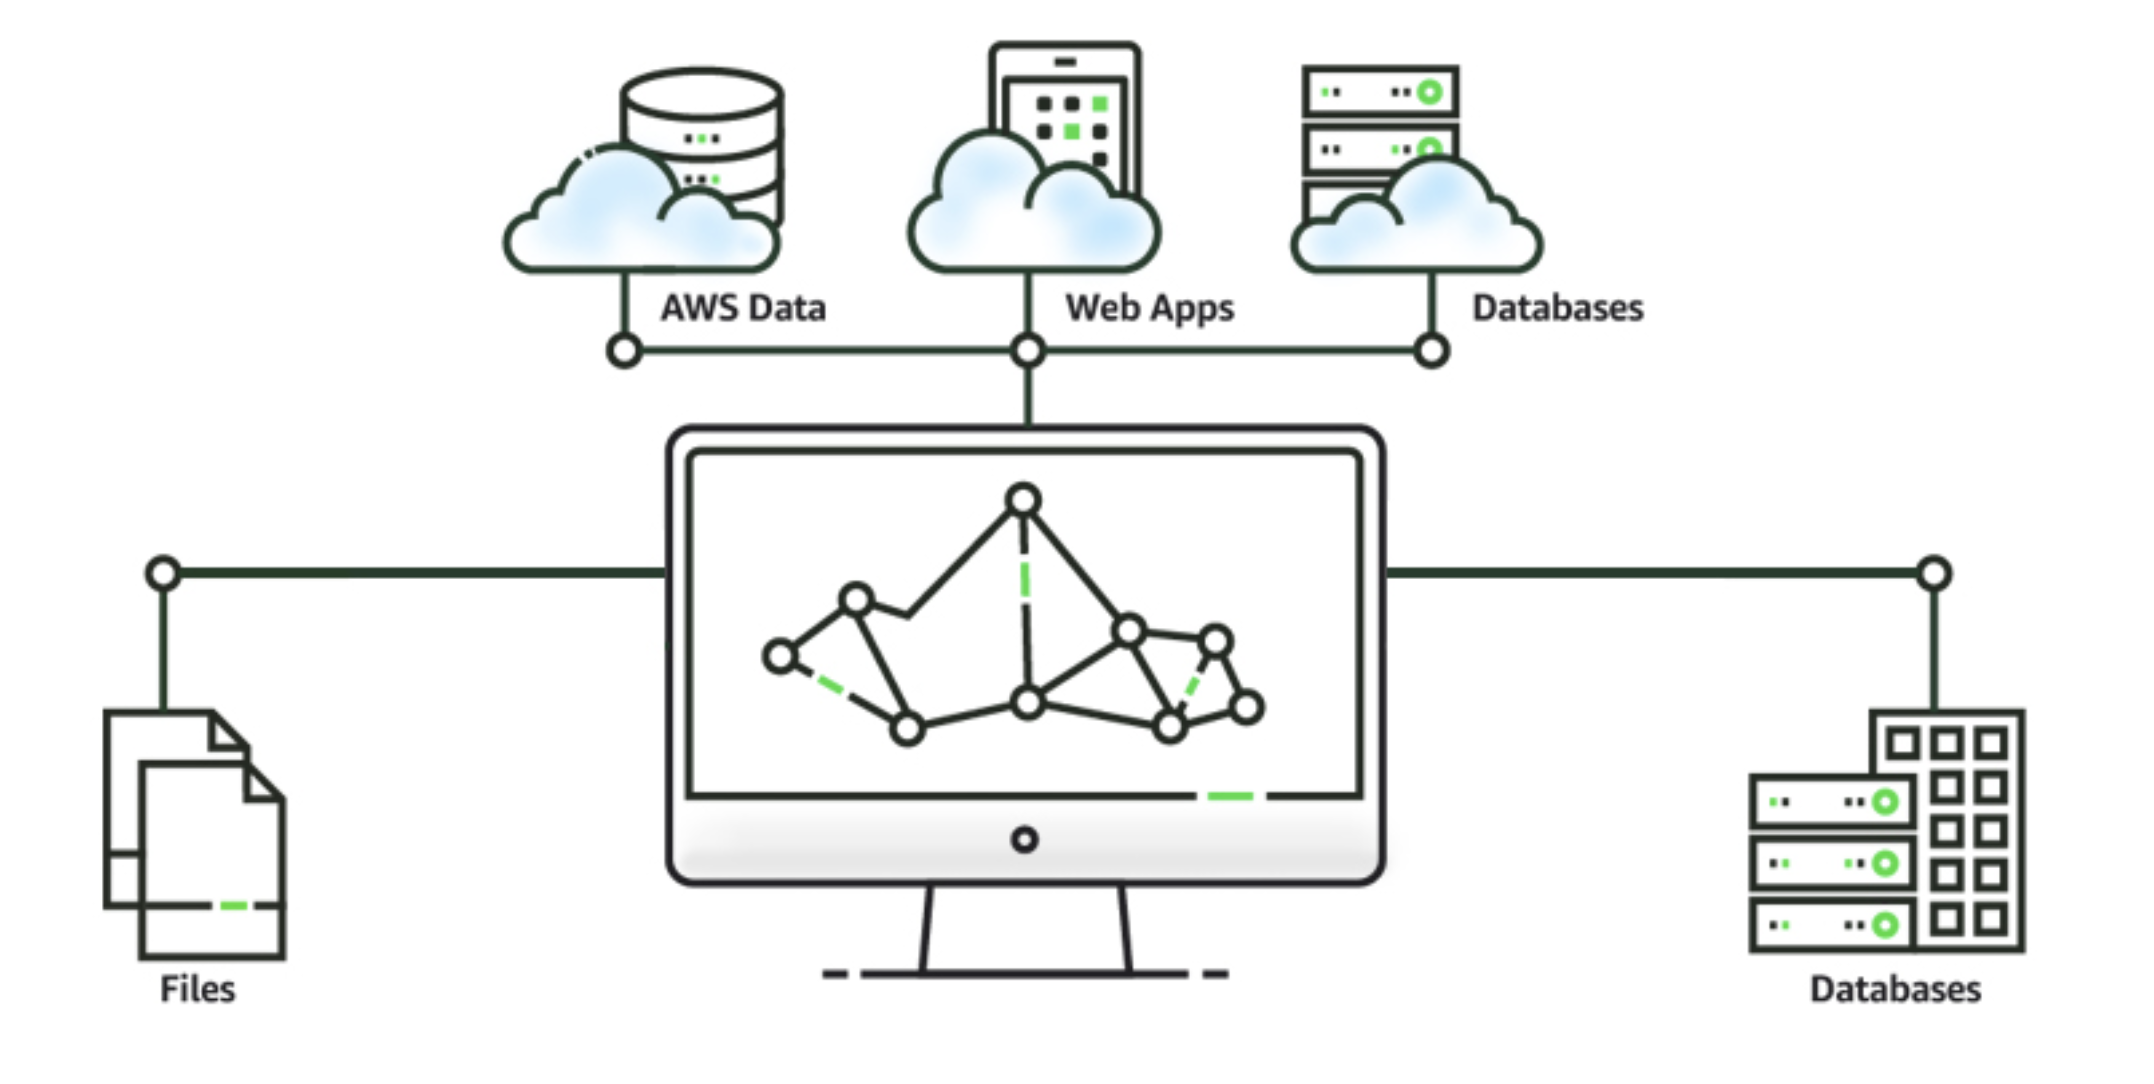
Amazon Web Services recently came out with a shiny new toy for us data enthusiasts — Amazon Quicksight. For those of you (also us) that’s already used to existing popular
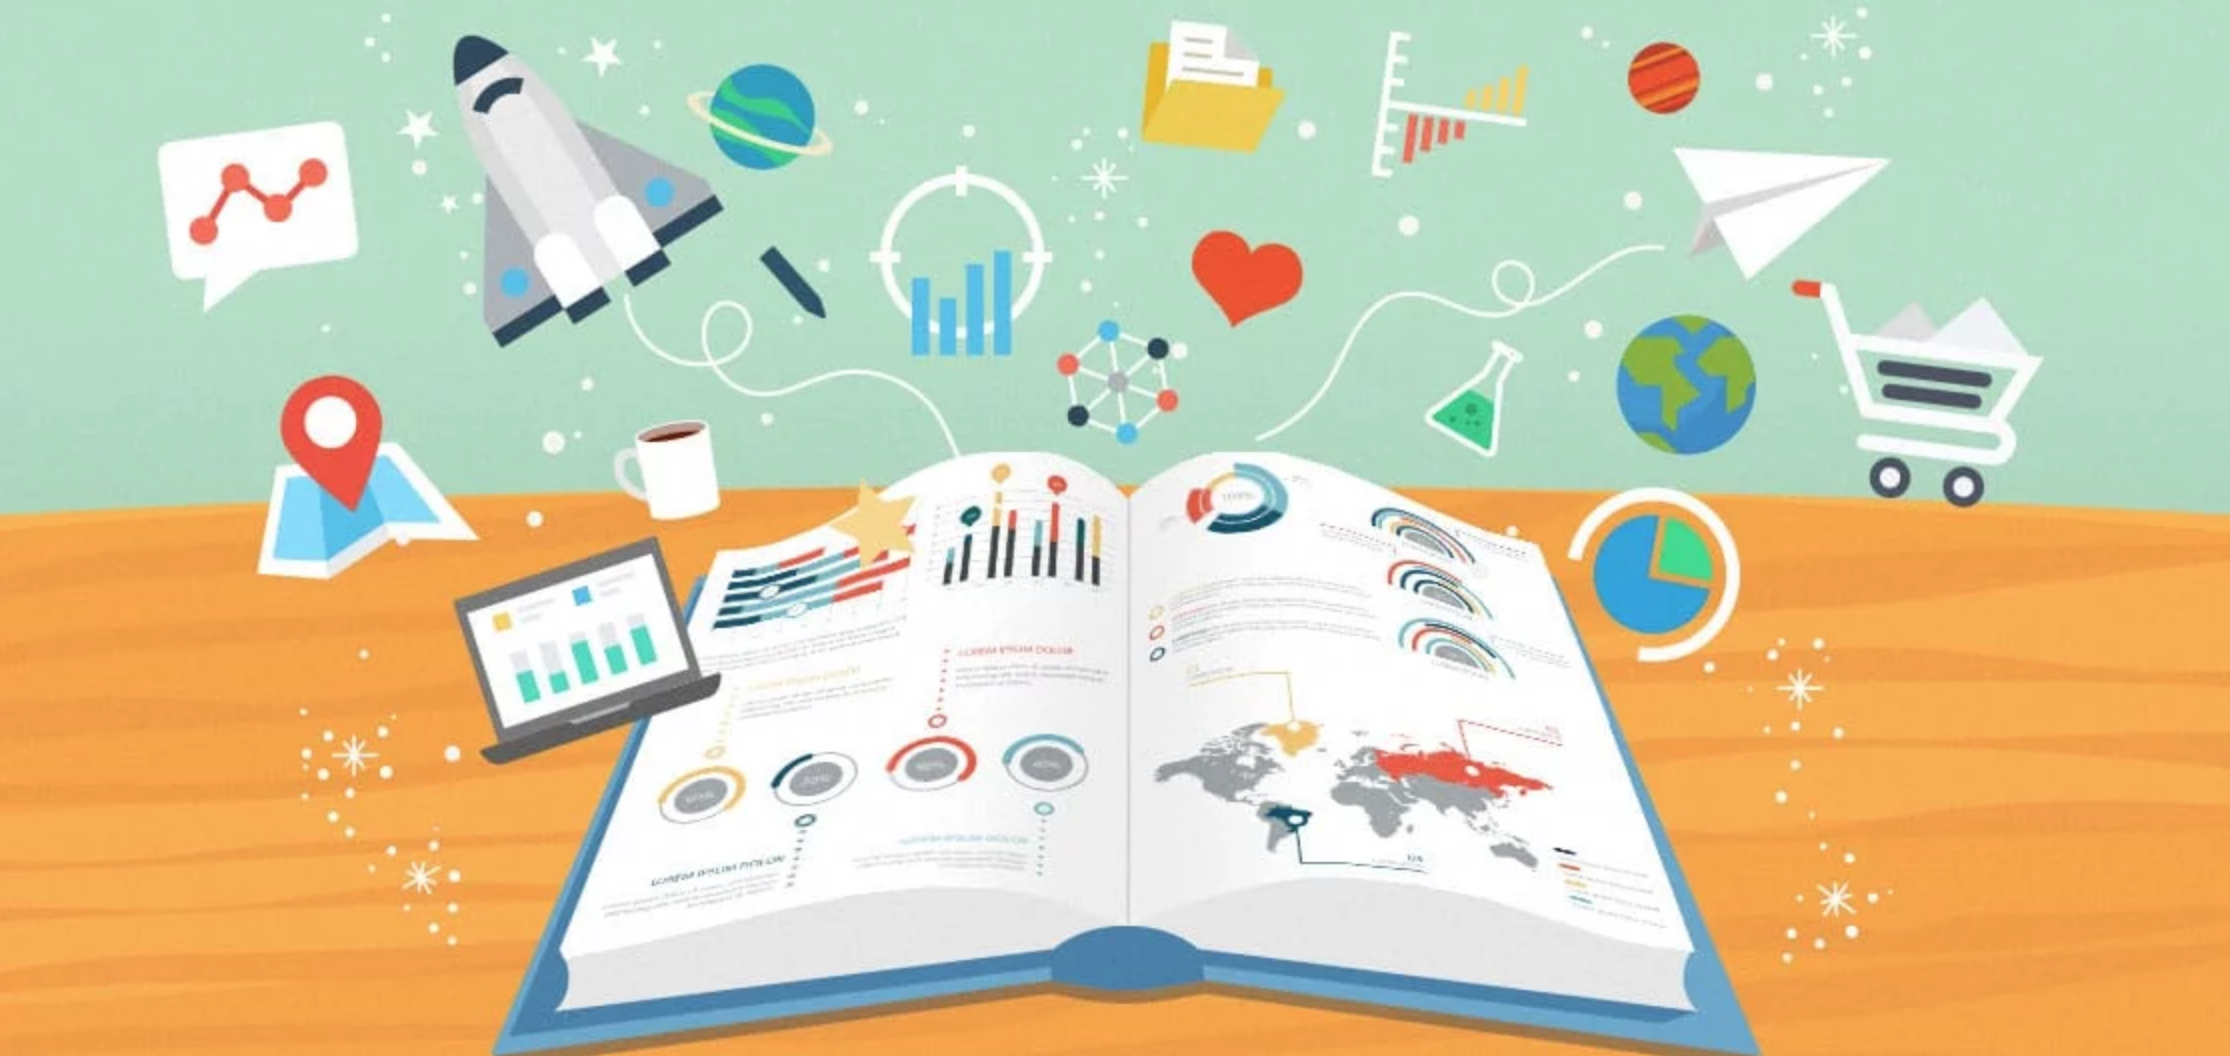
“Those who tell stories rule society.” – Plato In the past, the role of a data scientist or analyst is simple – to give the business data and present them in
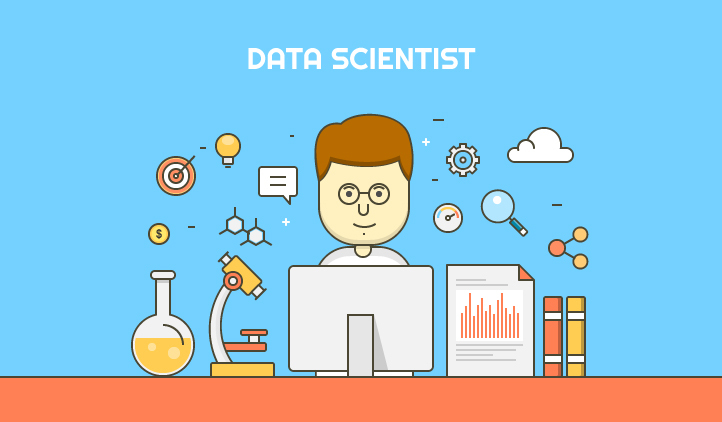
The term “Big Data” has gained lots of attention in recent years. Want to know what the sexiest job of the 21st century is? It’s Data Scientist (according to Harvard
The digital revolution today has brought disruption. Marketers have to think smart – and fast. Combined with the increasing and always-changing consumer expectations, decisions have to be made accurately and
Data Visualisation Style Guides – Tableau, Microsoft Excel, Highcharts & Infographics Captivating data viz needs good design. What is the use of amazing data if it’s not presented in an
Big Data can be complicated, lengthy and mind-bogglingly full of numbers. Like trying to explain a foggy picture, descriptive words can only do so much to relay what’s on paper.

Phew, can you believe it’s April already! Maybe they’re right when they say time runs faster as you get older. Even though the year has whizzed by, it’s never too