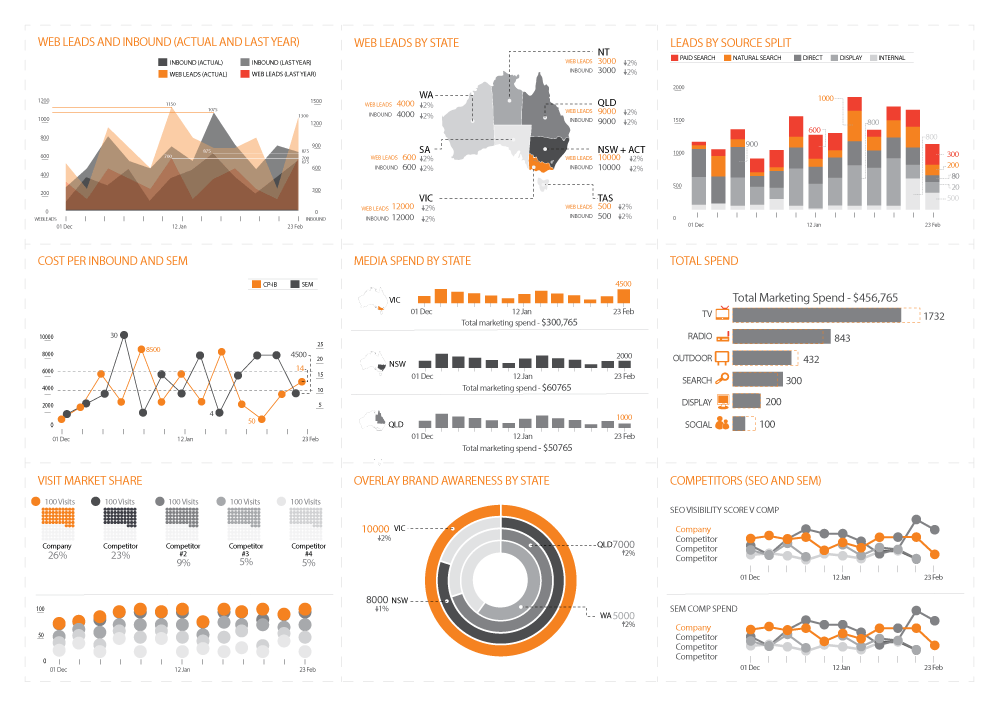
Case Study: Tableau Dashboard Report Aim: Create an interactive dashboard, utilizing Tableau, to convey the data that had been collected over the financial year. <a href=’#’><img alt=’Datalabs Tableau Dashboard
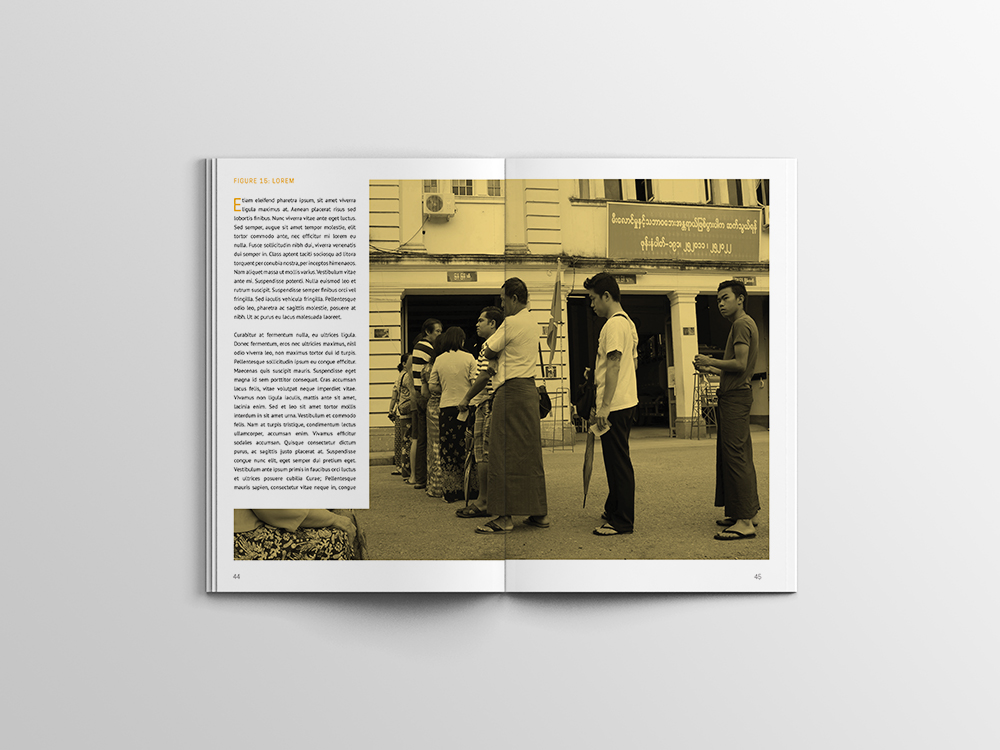
Case Study: A Long Infographic Report Design We recreated a long research report with an infographic style, using charts and graphs to convey the data they’d collected, over the period

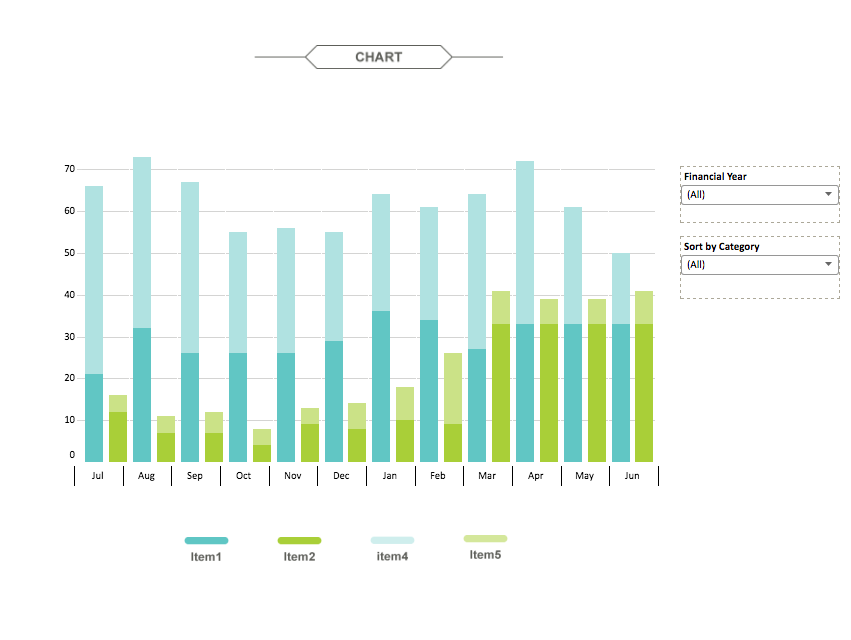
Excel Data Visualisation Artwork Project. Creating beautiful, artistic work exclusively in Excel. We were tasked by a digital agency to create something different for their client, using only the Microsoft product
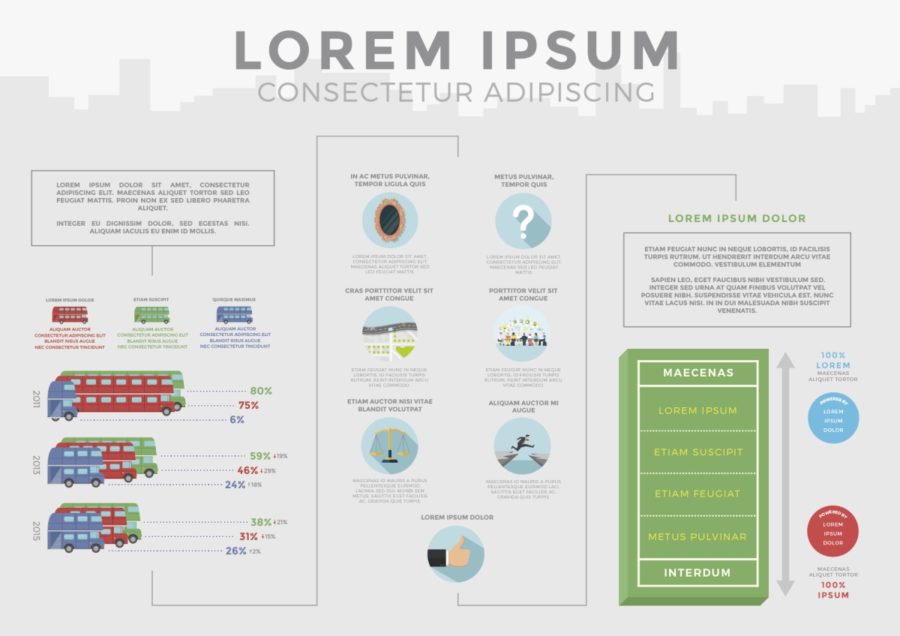
Datalabs were hired to create an infographic to visualise data from a client’s HR survey. This is a quick run down of how we went about designing and developing the infographic [one_third]
With Datalabs’ help, at a Marketing Director’s level, reporting is now a unified dashboard — simple and insightful. [one_third]An online healthcare and insurance company came to Datalabs with a problem: