Xero Infographic Report Designed by Datalabs At Datalabs, we create data visualisations for a range of clients and business types. We love what we do, but we can’t help but
We’ve compiled a small list of conferences definitely worth visiting in 2013. Events like this are a great way to see, learn, connect and be inspired. If you’re lucky enough to get a ticket, be sure to let us know so we could meet up and have a chat.
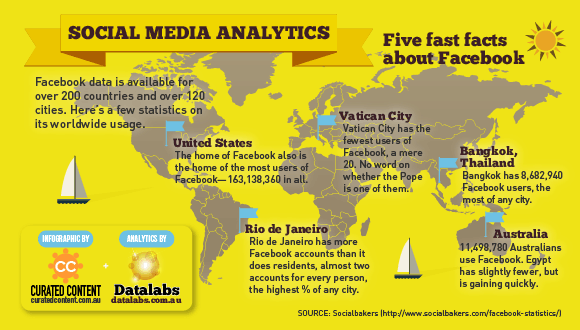
Facebook data is available for over 200 countries and over 120 cities. This infographic shows a few statistics on its worldwide usage. [alert_box type=”note”]Click the image above to see a PDF