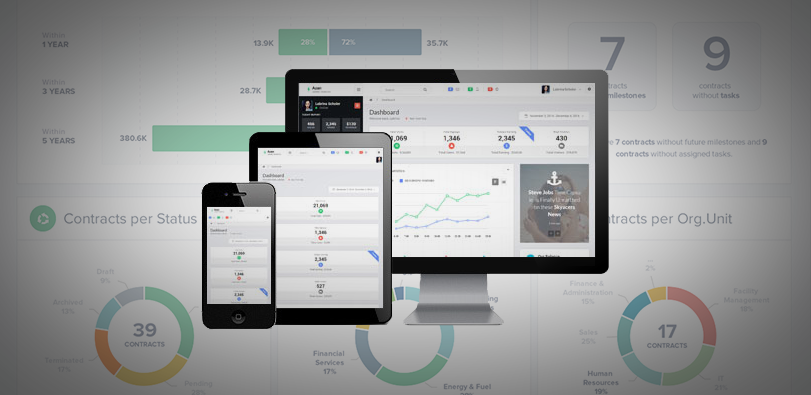
6 of the Best Marketing Dashboards … And why your business needs one! Tired of tiny details and endless numbers on your marketing strategy report? Tired of constantly opening new tabs

6 Examples of How Best To Visualize Net Promoter Score Love it, hate it (or neither…) – Net Promoter Score (NPS) is a key success measure in countless businesses across the world.
Our List of Data Visualization Conferences for 2017 With Christmas decorations now flooding department stores, we figured it was time to update our list of data visualization conferences and events
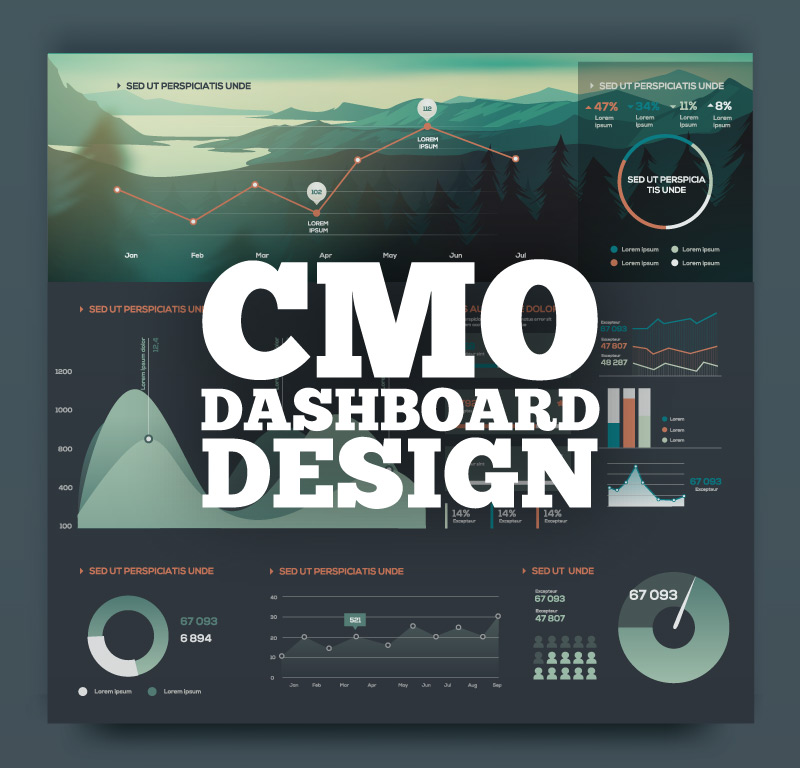
Recruiting a Chief Marketing Officer in a data-driven world isn’t easy. Heads of corporate marketing often rise through the ranks without the scientific or technological background needed today. This presentation

“A Golden Age of Interface Design is coming. The creative and visual direction of data design can be inspiring and creative. Let’s make sure it is. Here’s a vision and
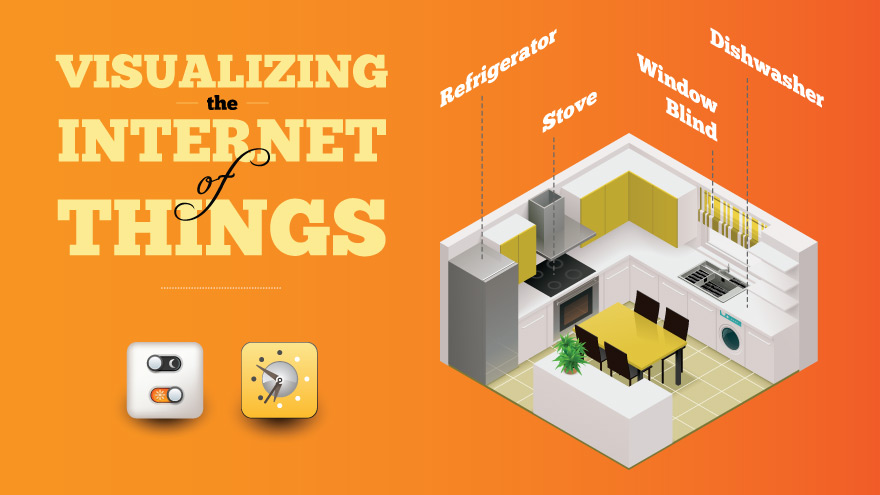
No Chief Data, Chief Digital, or Chief Marketing Officer will be spared the deluge of data coming from the Internet of Things (IoT). I propose the challenge initially isn’t a
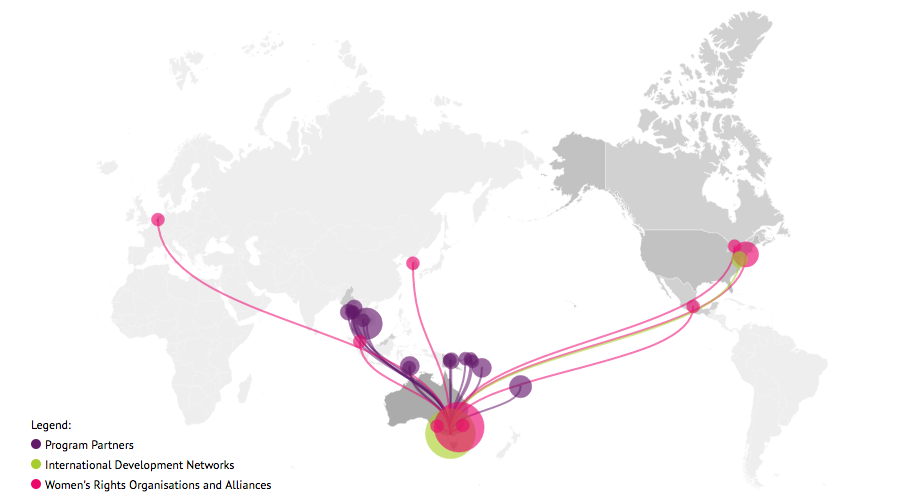
Digital Animated Map Case Study A real, live example of an interactive map developed for International Women’s Development Agency. Click on the nodes to interact Who: International Women’s Development Agency

Datalabs is looking to add an Animator & Motion Graphic Designer to our team here at Datalabs. About the Animator & Motion Graphic Designer role: Our Animators & Motion Graphic

How to Tell a Story With Data Visualization Ideas and examples you can use in your organization to create a data-driven narrative The idea of collecting and storing massive amounts

What is a microsite & what are they used for? A look at what makes a good microsite, how they differ to a website & some great examples. In previous