Data Visualization and the Big Three Strategy Consulting and Big Four Accounting Firms How does a creative data visualization and visual analytics agency get along with the ‘suits’? Combing through

Australian data visualization and analytics company, The Datalabs Agency, has announced its expansion into the U.S. market, opening an office in Los Angeles in early September. According to its Managing
Datalabs is looking to add a Front-End Developer with experience in JavaScript, Jquery, Bootstrap, Nodejs, Gulp, GIT, SASS, and HTML5 developer, with experience in data visualisation. About the Front-End Developer
Our List of Data Visualisation Conferences for 2016 *Update November 2016* We’ve updated this list for 2017’s conferences. Click the link to see the best data visualisation conference for 2017.
The Most Common Type of Data Visualisations & Examples 15 Chart Types, Visualisations and How To Use Them With the growing amount and accessibility of data, data visualisation is becoming
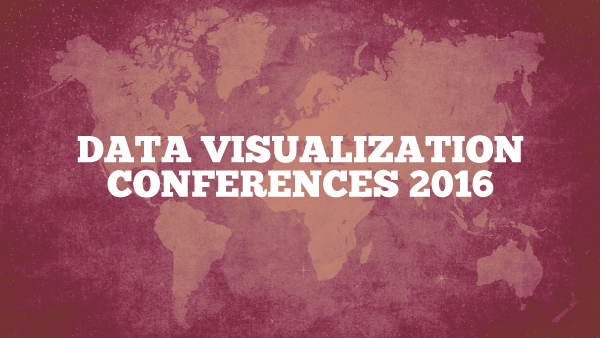
Editor’s Note – We’ve got an updated list with 2016’s the new dates and other great events here: Data Visualization Conferences 2016 With the new year coming up, and new travel budgets
What is the Business Case for Data Visualisation? Data is ubiquitous these days, but it wasn’t always that way. Data collection used to be limited to hand-written records and/or oral

The Need For Data Visualisation Skills In Business A guide to skilling-up your employees An SAP-sponsored survey recently questioned business leaders about their opinions regarding the uptake and effectiveness
Salespeople and their managers are extremely time-poor and extremely focused on their job: selling. They don’t have a lot of time to read through endless sales reports or to click

All industries have a critical need for visual analytics. The insights that can come immediately from a well-designed business dashboard or data visualization in the finance industry could provide the