5 Examples of Dashboards We Love and Why. To finish up the year, we thought we’d showcase a few dashboards that caught our collective eyes here at Datalabs HQ. There isn’t a
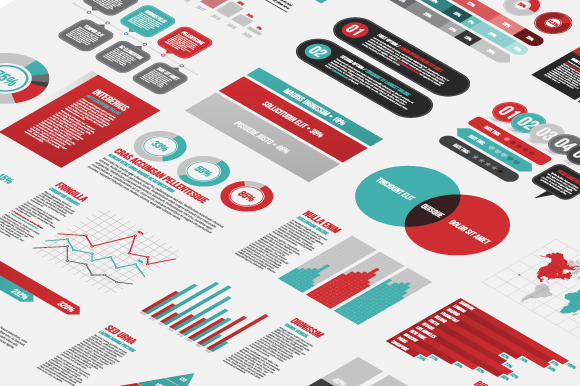
8 More Common Types of Data Visaualization Following up on our previous list of 15 Types of Data Visualization, which you can find here, we’ve come up with 8 more
Our List of Data Visualisation Conferences for 2016 *Update November 2016* We’ve updated this list for 2017’s conferences. Click the link to see the best data visualisation conference for 2017.
4 Reasons Your Business Should Be Using a Dashboard in Google Analytics & Why. Google Analytics is the go-to tool for most business web traffic collection. It’s lightweight, robust, easy

“The universe is made of stories, not atoms.” – Muriel Rukeyser Data As Digital Story Telling For Business Data is everywhere, and increasingly, business, government and even non-profits are expected

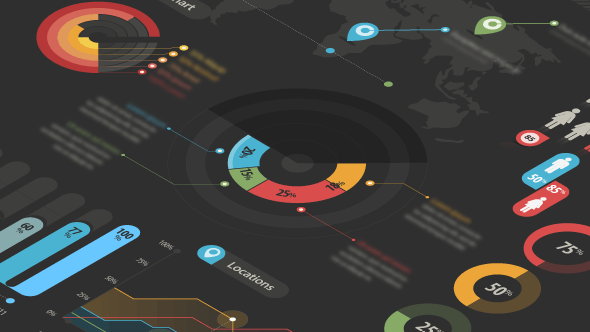
5 Captivating Information Visualization Examples Beyond Infographics, Charts & Graphs Thanks to the ubiquitous infographic, most people are well-acquainted with information visualization. But infographics aside, we believe the field of

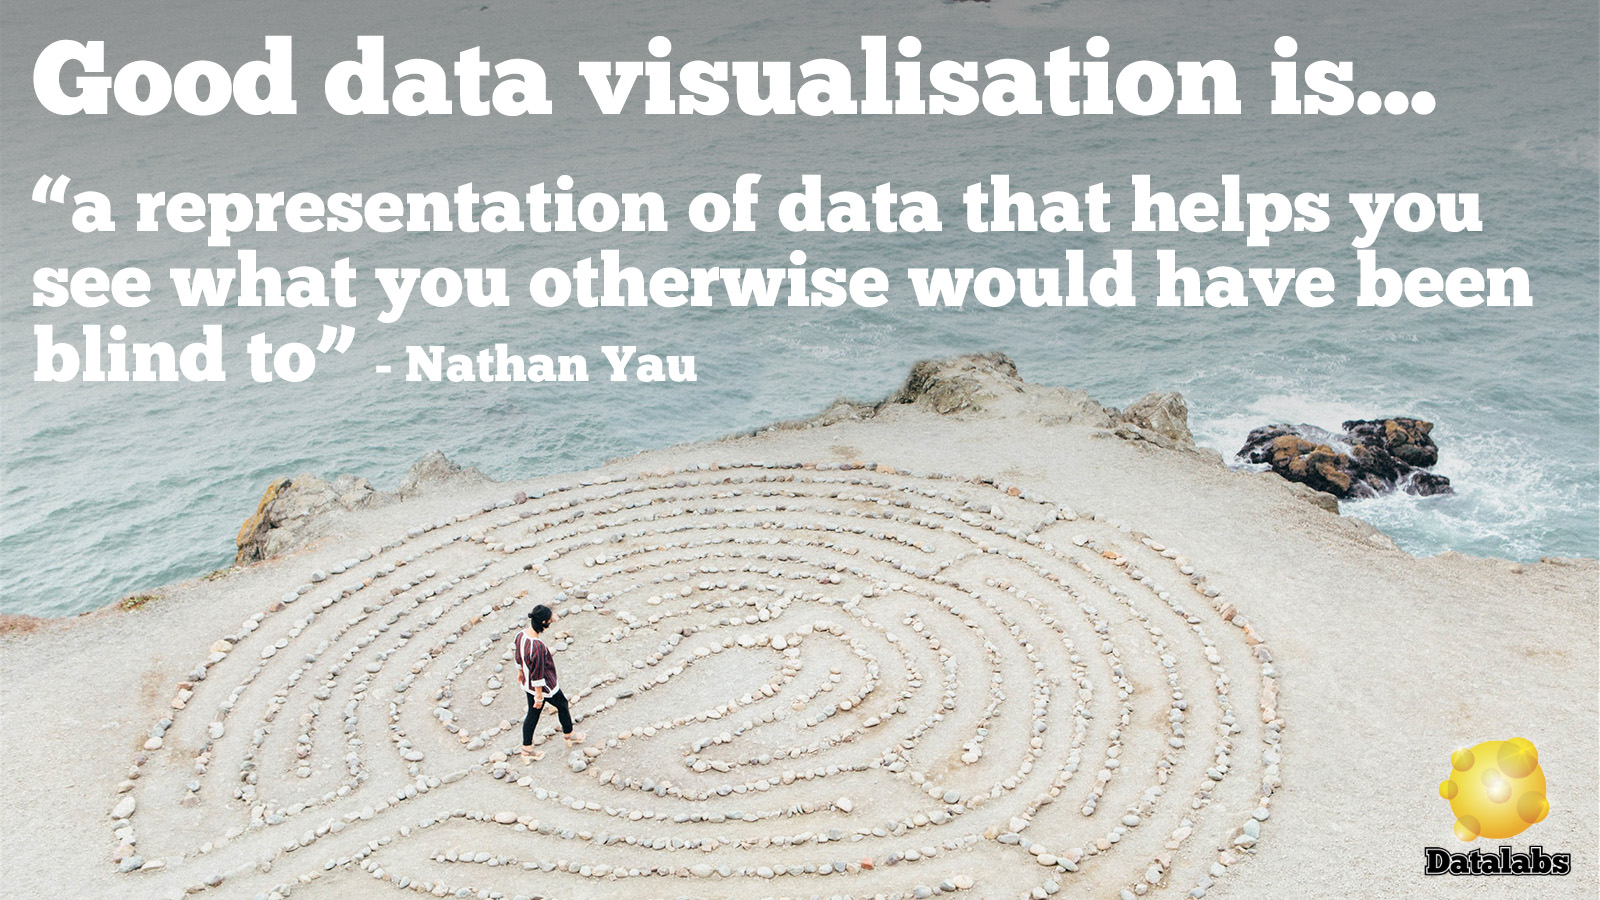
What Makes for Great Data Visualization and Why? Data visualization can be a powerful way to communicate. When done right, it delivers information with both the weight of respected research,
Content Marketing Analytics – Consider Before You Share. – If you’re a business, the takeaway is that sharing without analytics is essentially useless, that engagement is not as valuable as insight,
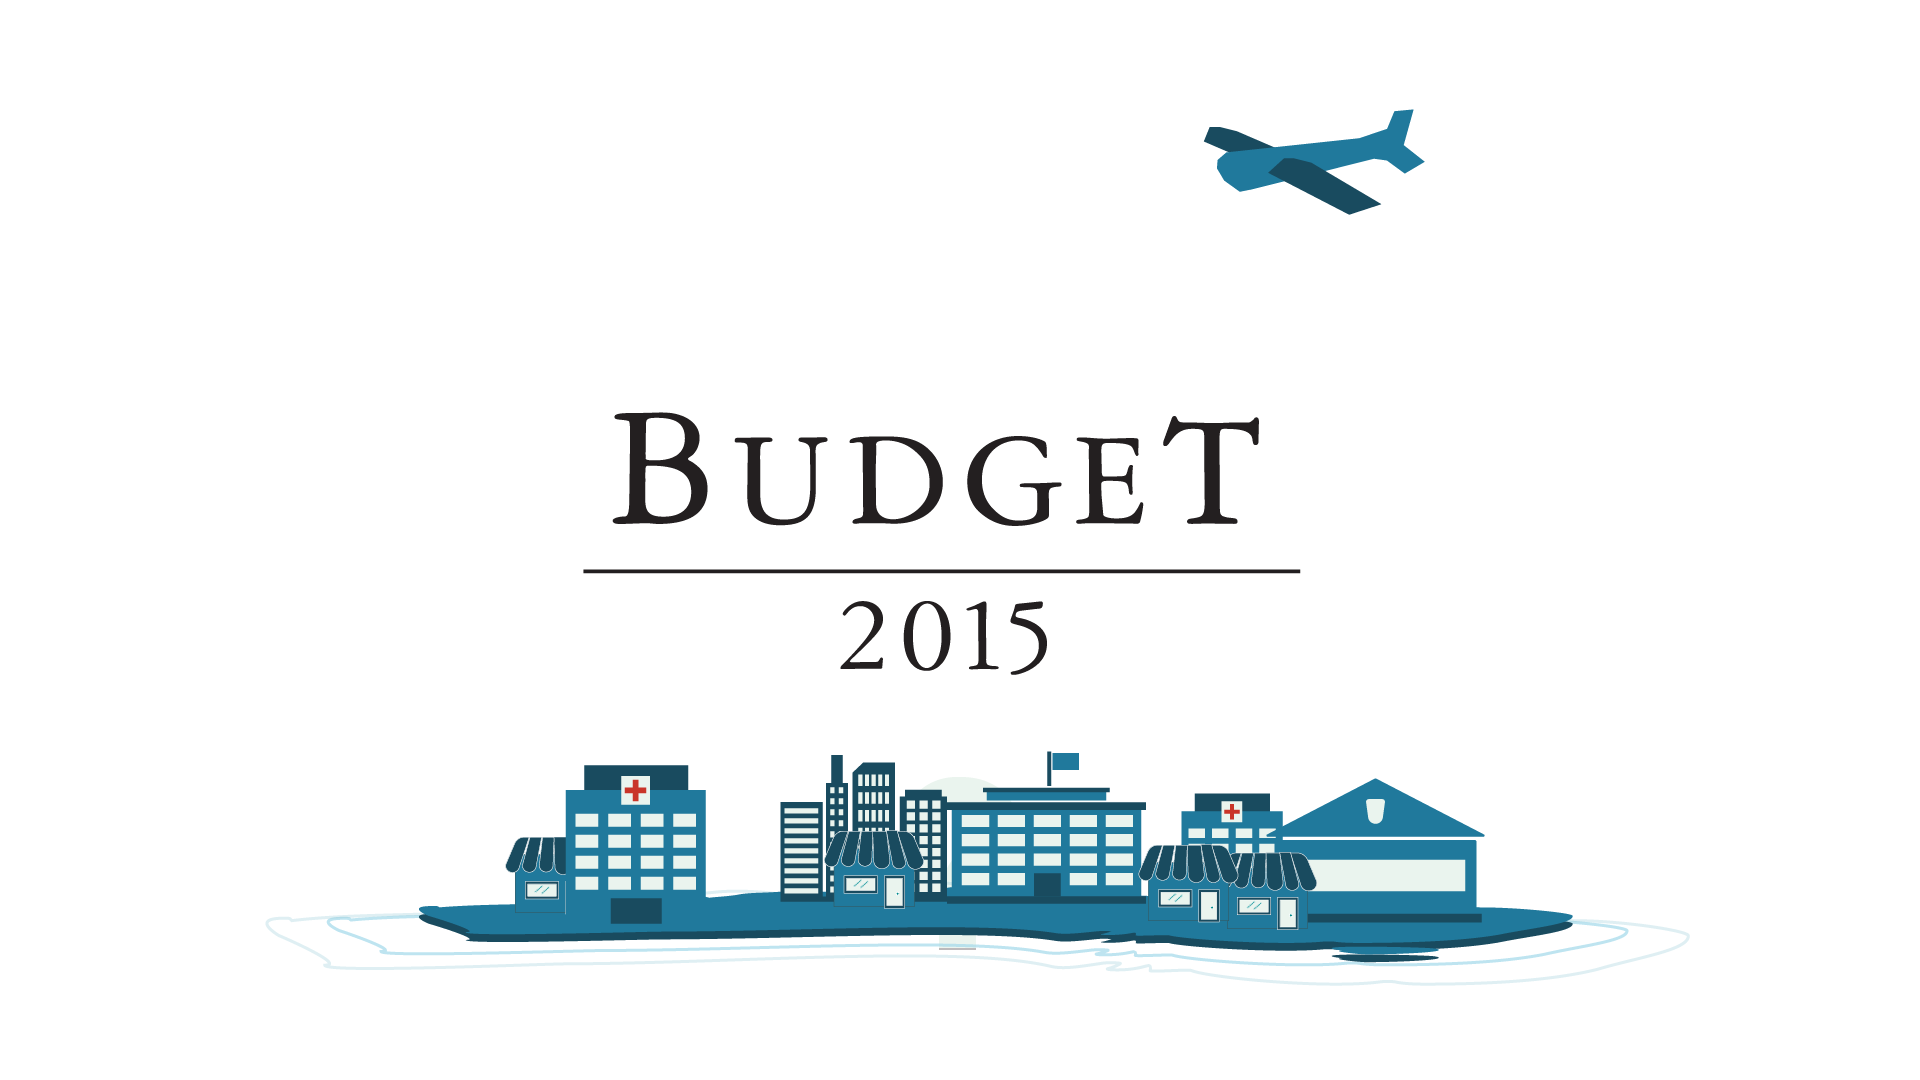
Datalabs is proud to show our work with the Federal Department of the Treasury for the 2015 Budget. Datalabs was hired in April to animate three videos, visualising the overview

3 Tips To Master Google Analytics Google Analytics can illuminate the path to success in digital campaigns by providing insight into what’s working and what’s not. The problem is, many