We’re looking to add an infographic design intern to our team here at Datalabs. About the Infographic Designer (Intern) role: Our Infographic Designers are the agency’s creative visualisers and graphic
Data Visualization and the Big Three Strategy Consulting and Big Four Accounting Firms How does a creative data visualization and visual analytics agency get along with the ‘suits’? Combing through

Australian data visualization and analytics company, The Datalabs Agency, has announced its expansion into the U.S. market, opening an office in Los Angeles in early September. According to its Managing

7 Killer Microsites & Interactive Web Design Experiences That Will Inspire You! Microsites, journey maps, timelines, stories and interactive data tools! If a good infographic tells a story, then an equally great

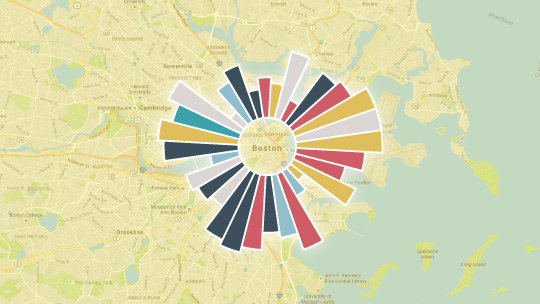
Interactive Timeline User Journey – Click The Infographic A project for Monash Health showing customers journey through the healthcare system over 9 years Timeframe: 8 weeks Tools: Adobe Illustrator, Excel, HTML/JS/CSS
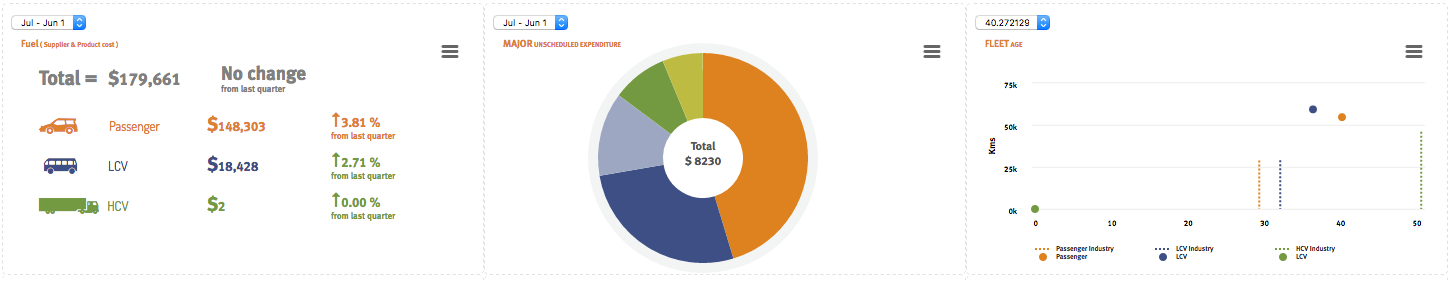
Financial Operations & Reporting BI Dashboards A business dashboard for reviewing risk Our client offers vehicle fleet leasing and management, Australia-wide and internationally. Their solutions are time saving and cost effective, as well

5 Tips For Designing a Great Dashboard Not all dashboards are created equal – here’s how to get it right from the designers at Datalabs. Infographic dashboards are massively useful

Telling Stories With Data: From Simplification to Persuasion and Reporting. The Most Common Questions From Our Data Visualisation Workshops. We run our Data Visualisation Workshops Australia-wide, and each session is started with
Datalabs is looking to add a Front-End Developer with experience in JavaScript, Jquery, Bootstrap, Nodejs, Gulp, GIT, SASS, and HTML5 developer, with experience in data visualisation. About the Front-End Developer
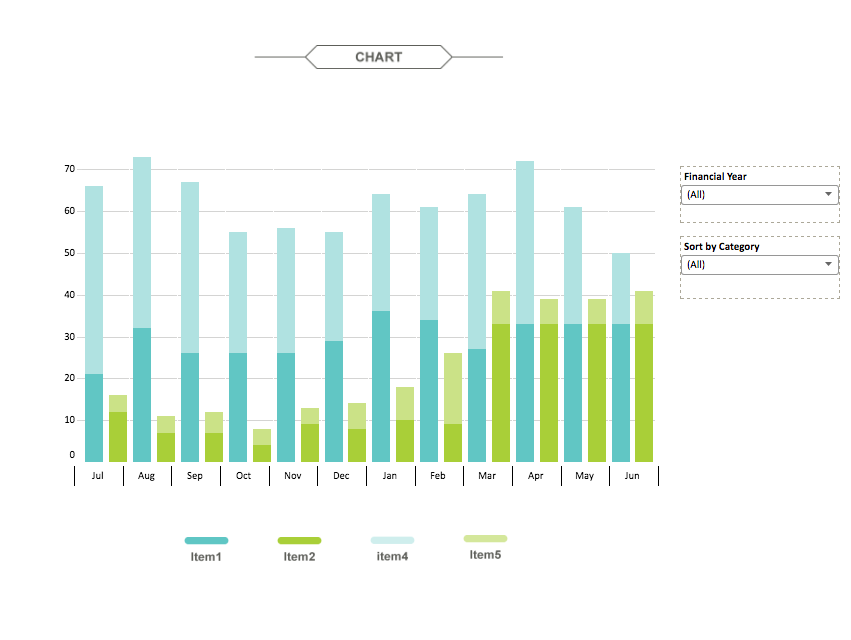
Case Study: Tableau Dashboard Report Aim: Create an interactive dashboard, utilizing Tableau, to convey the data that had been collected over the financial year. <a href=’#’><img alt=’Datalabs Tableau Dashboard