
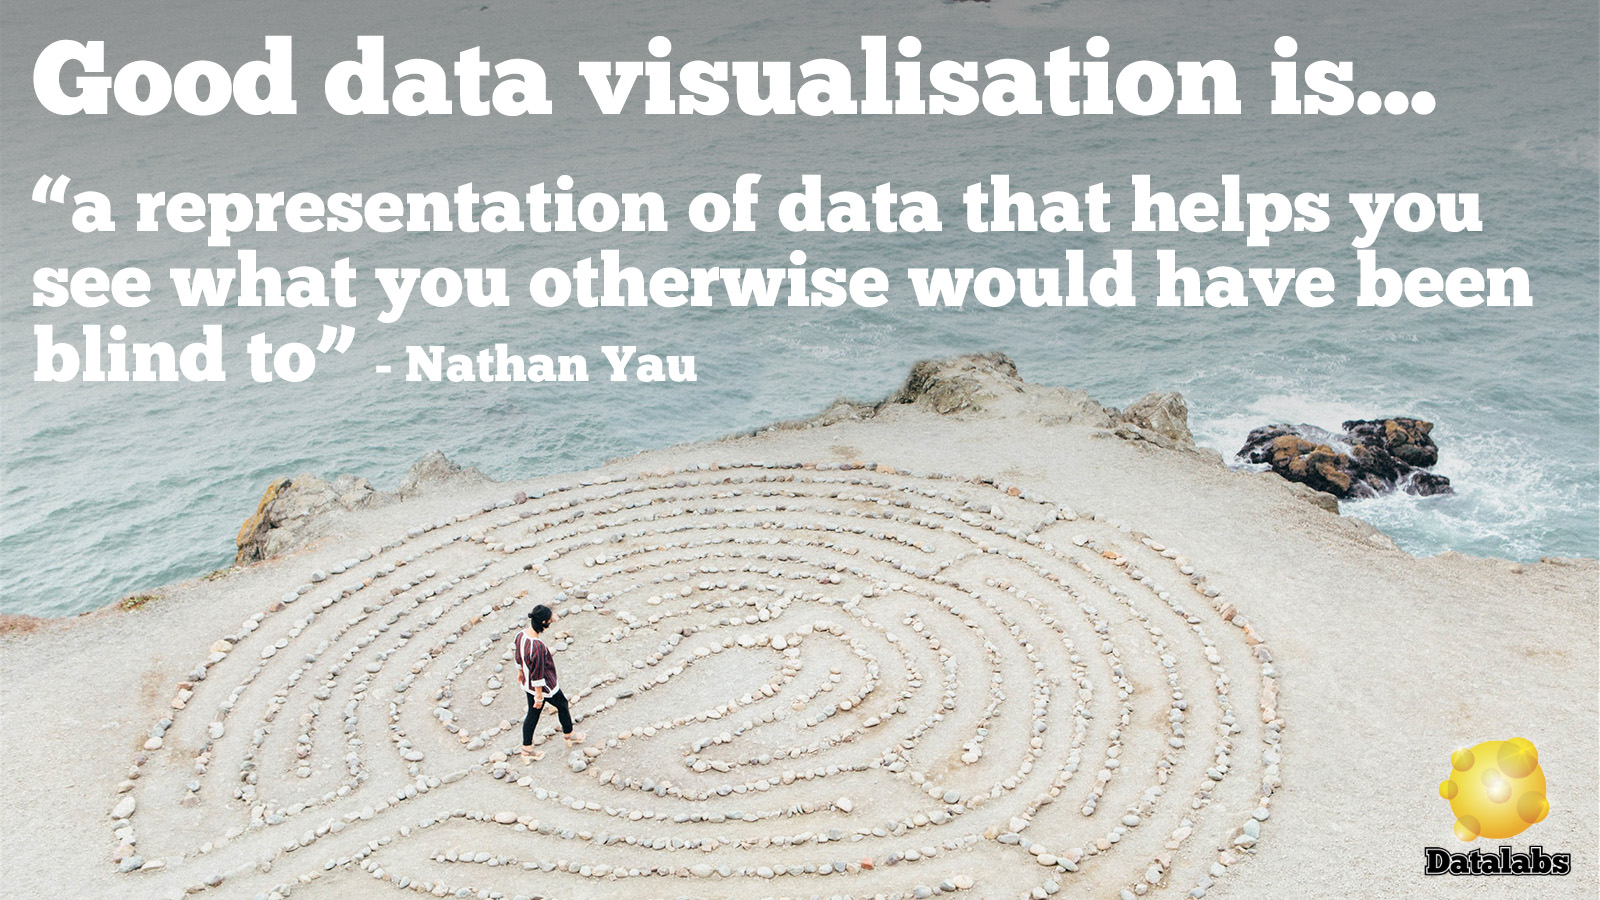
Empowering Employees to Make Better Decisions Through Visual Analytics. “Seeing is believing, but sometimes the most real things in the world are the things we can’t see”, – The Polar

4 Challenges Facing Business & Data Analysts Right Now “Without big data analytics, companies are blind and deaf, wandering out onto the web like deer on a freeway.” – Geoffrey Moore

Brilliant Examples of What Tableau Can Do A list of the best dashboards we’ve found on the web. Tableau is a data visualization tool making it possible for just about
4 Marketing Analytics Trends That Will Kill It In 2016 As digital marketing continues to evolve and marketers gear up for 2016, here are the 4 analytics trends that we

2016 is already off to a great start, with our announcement that we’re expanding in to Asia and opening a Hong Kong office. Our press release can be read in full
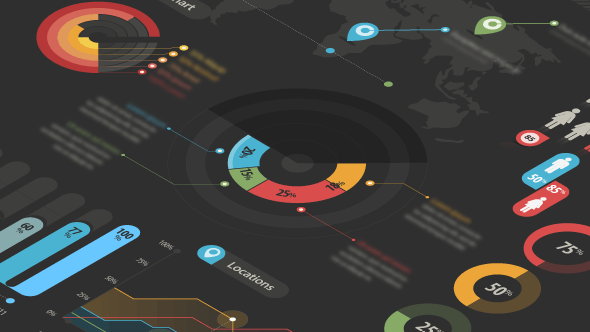
5 Examples of Dashboards We Love and Why. To finish up the year, we thought we’d showcase a few dashboards that caught our collective eyes here at Datalabs HQ. There isn’t a
8 More Common Types of Data Visaualization Following up on our previous list of 15 Types of Data Visualization, which you can find here, we’ve come up with 8 more
Our List of Data Visualisation Conferences for 2016 *Update November 2016* We’ve updated this list for 2017’s conferences. Click the link to see the best data visualisation conference for 2017.
4 Reasons Your Business Should Be Using a Dashboard in Google Analytics & Why. Google Analytics is the go-to tool for most business web traffic collection. It’s lightweight, robust, easy

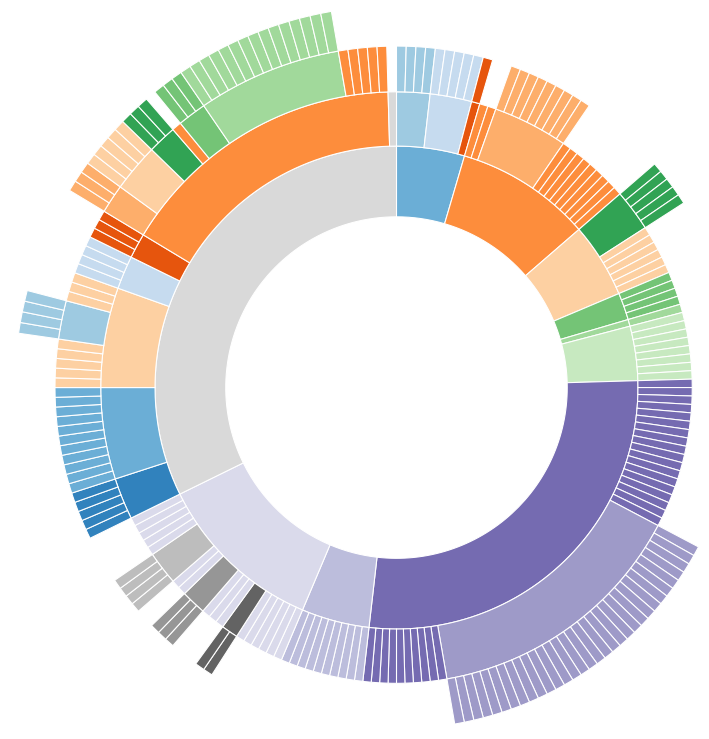
5 Captivating Information Visualization Examples Beyond Infographics, Charts & Graphs Thanks to the ubiquitous infographic, most people are well-acquainted with information visualization. But infographics aside, we believe the field of